Plot summariseMeasurementTiming results.
Source:R/plotMeasurementValueAsNumeric.R
plotMeasurementValueAsNumber.RdPlot summariseMeasurementTiming results.
Usage
plotMeasurementValueAsNumber(
  result,
  x = "unit_concept_name",
  plotType = "boxplot",
  facet = c("codelist_name", "concept_name"),
  colour = c("cdm_name", "unit_concept_name", visOmopResults::strataColumns(result)),
  style = NULL
)
Arguments
- result
A summarised_result object.
- x
Variable to plot on the x axis when plotType is "boxlot" or "barplot".
- plotType
Type of plot, either "boxplot", "barplot", or "densityplot".
- facet
Columns to facet by. See options with `visOmopResults::plotColumns(result)`. Formula input is also allowed to specify rows and columns.
- colour
Columns to color by. See options with `visOmopResults::plotColumns(result)`.
- style
Pre-defined style to apply: "default" or "darwin" - the latter just for gt and flextable. If NULL the "default" style is used.
Examples
# \donttest{
library(MeasurementDiagnostics)
cdm <- mockMeasurementDiagnostics()
result <- summariseMeasurementUse(
cdm = cdm,
bySex = TRUE,
codes = list("test_codelist" = c(3001467L, 45875977L))
)
#> → Sampling measurement table to 20000 subjects
#> → Getting measurement records based on 2 concepts.
#> → Subsetting records to the subjects and timing of interest.
#> → Getting time between records per person.
#> Summarising timings
#> ℹ The following estimates will be calculated:
#> • days_between_measurements: min, q25, median, q75, max, density
#> ! Table is collected to memory as not all requested estimates are supported on
#> the database side
#> → Start summary of data, at 2026-02-16 19:57:10.374136
#> ✔ Summary finished, at 2026-02-16 19:57:10.575704
#> → Getting measurements per subject.
#> ℹ The following estimates will be calculated:
#> • measurements_per_subject: min, q25, median, q75, max, density
#> ! Table is collected to memory as not all requested estimates are supported on
#> the database side
#> → Start summary of data, at 2026-02-16 19:57:11.134042
#> ✔ Summary finished, at 2026-02-16 19:57:11.242775
#> ℹ The following estimates will be calculated:
#> • measurements_per_subject: min, q25, median, q75, max, density
#> ! Table is collected to memory as not all requested estimates are supported on
#> the database side
#> → Start summary of data, at 2026-02-16 19:57:11.875537
#> ✔ Summary finished, at 2026-02-16 19:57:11.979013
#> → Summarising results - value as number.
#> Summarising value as number
#> ℹ The following estimates will be calculated:
#> • value_as_number: min, q01, q05, q25, median, q75, q95, q99, max,
#> count_missing, percentage_missing, density
#> ! Table is collected to memory as not all requested estimates are supported on
#> the database side
#> → Start summary of data, at 2026-02-16 19:57:13.744903
#> ✔ Summary finished, at 2026-02-16 19:57:14.357035
#> → Summarising results - value as concept.
#> Summarising value as number
#> ℹ The following estimates will be calculated:
#> • value_as_concept_id: count, percentage
#> → Start summary of data, at 2026-02-16 19:57:15.094984
#> ✔ Summary finished, at 2026-02-16 19:57:15.40728
#> → Binding all diagnostic results.
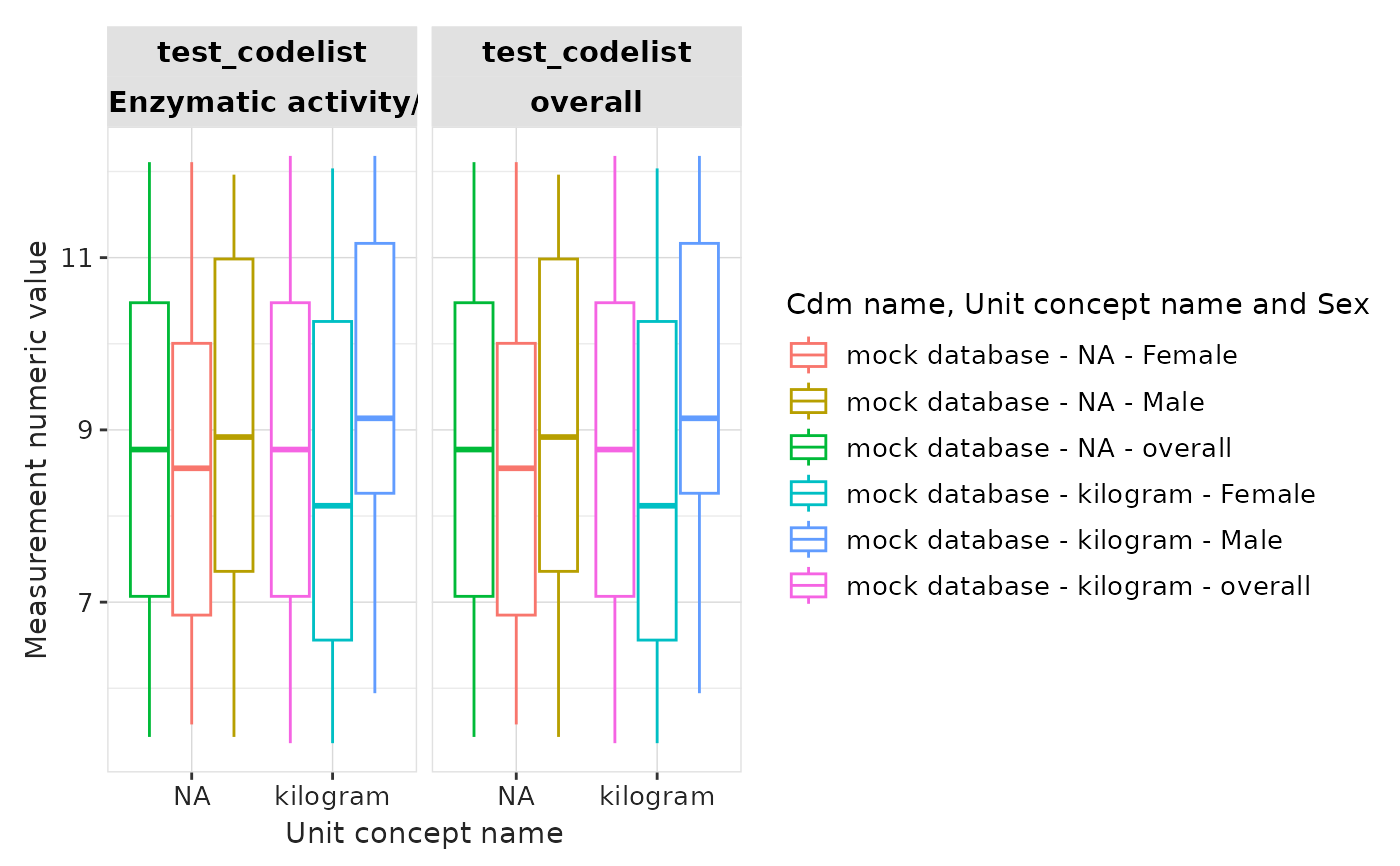
plotMeasurementValueAsNumber(result)
 CDMConnector::cdmDisconnect(cdm)
# }
CDMConnector::cdmDisconnect(cdm)
# }