Creates nice cohort method plots
Usage
plotCmEstimates(
  cmData,
  cmDiagnostics = NULL,
  cmMeta = NULL,
  cohortNames = NULL,
  includeCounts = TRUE,
  selectedAnalysisId = NULL
)
Arguments
- cmData
The cohort method data
- cmDiagnostics
(optional) The cohort method diagnostic data
- cmMeta
(optional) The cohort method evidence synthesis data
- cohortNames
A data.frame with columns cohortId and cohortName
- includeCounts
Whether to include the target/comp size and event counts
- selectedAnalysisId
The analysis ID of interest to plot
See also
Other Estimation:
.getCmVersion(),
.getSccsVersion(),
getCMEstimation(),
getCmDiagnosticsData(),
getCmMetaEstimation(),
getCmNegativeControlEstimates(),
getCmOutcomes(),
getCmPropensityModel(),
getCmTable(),
getCmTargets(),
getSccsDiagnosticsData(),
getSccsEstimation(),
getSccsMetaEstimation(),
getSccsModel(),
getSccsNegativeControlEstimates(),
getSccsOutcomes(),
getSccsTable(),
getSccsTargets(),
getSccsTimeToEvent(),
plotSccsEstimates()
Examples
conDet <- getExampleConnectionDetails()
connectionHandler <- ResultModelManager::ConnectionHandler$new(conDet)
#> Connecting using SQLite driver
cmEst <- getCMEstimation(
connectionHandler = connectionHandler,
schema = 'main',
targetIds = 1002,
outcomeIds = 3
)
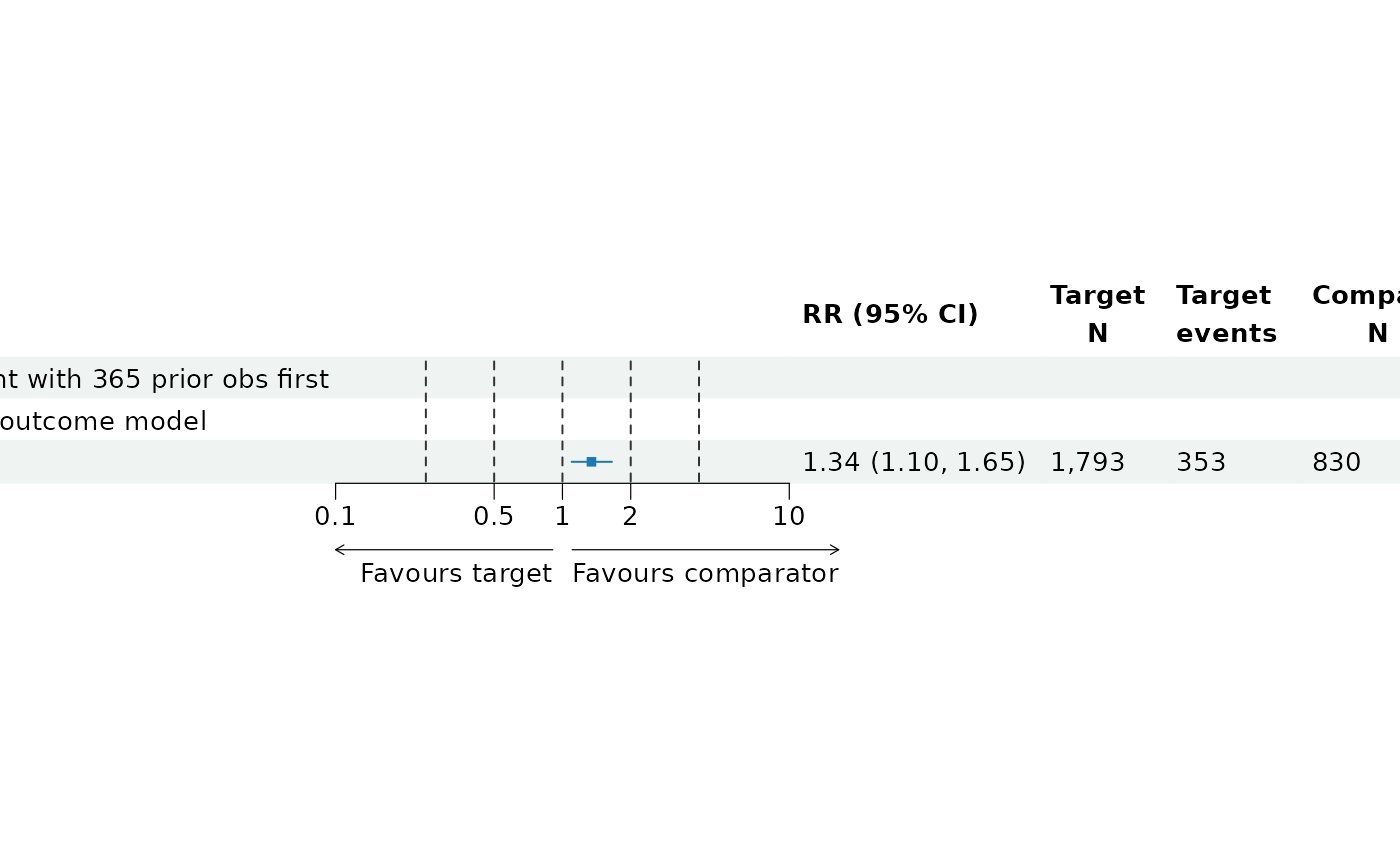
plotCmEstimates(
cmData = cmEst,
cmMeta = NULL,
selectedAnalysisId = 1
)
#> refline_col will be deprecated, use refline_gp instead.
#> footnote_col will be deprecated, use footnote_gp instead.
#> $`Celecoxib - first event with 365 prior obs first event with 365 prior obs-GI bleed-NA`
 #>
#>