Plot the concept counts of a summariseConceptCounts output.
Source:R/plotConceptCounts.R
plotConceptCounts.RdPlot the concept counts of a summariseConceptCounts output.
Arguments
- result
A summarised_result object (output of summariseConceptCounts).
- facet
Columns to face by. Formula format can be provided. See possible columns to face by with:
visOmopResults::tidyColumns().- colour
Columns to colour by. See possible columns to colour by with:
visOmopResults::tidyColumns().
Examples
# \donttest{
library(dplyr)
#>
#> Attaching package: ‘dplyr’
#> The following objects are masked from ‘package:stats’:
#>
#> filter, lag
#> The following objects are masked from ‘package:base’:
#>
#> intersect, setdiff, setequal, union
cdm <- mockOmopSketch()
result <- cdm |>
summariseConceptCounts(
conceptId = list(
"Renal agenesis" = 194152,
"Manic mood" = c(4226696, 4304866, 37110496, 40371897)
)
)
#> ℹ Getting concept counts of Renal agenesis
#> ℹ Getting concept counts of Manic mood
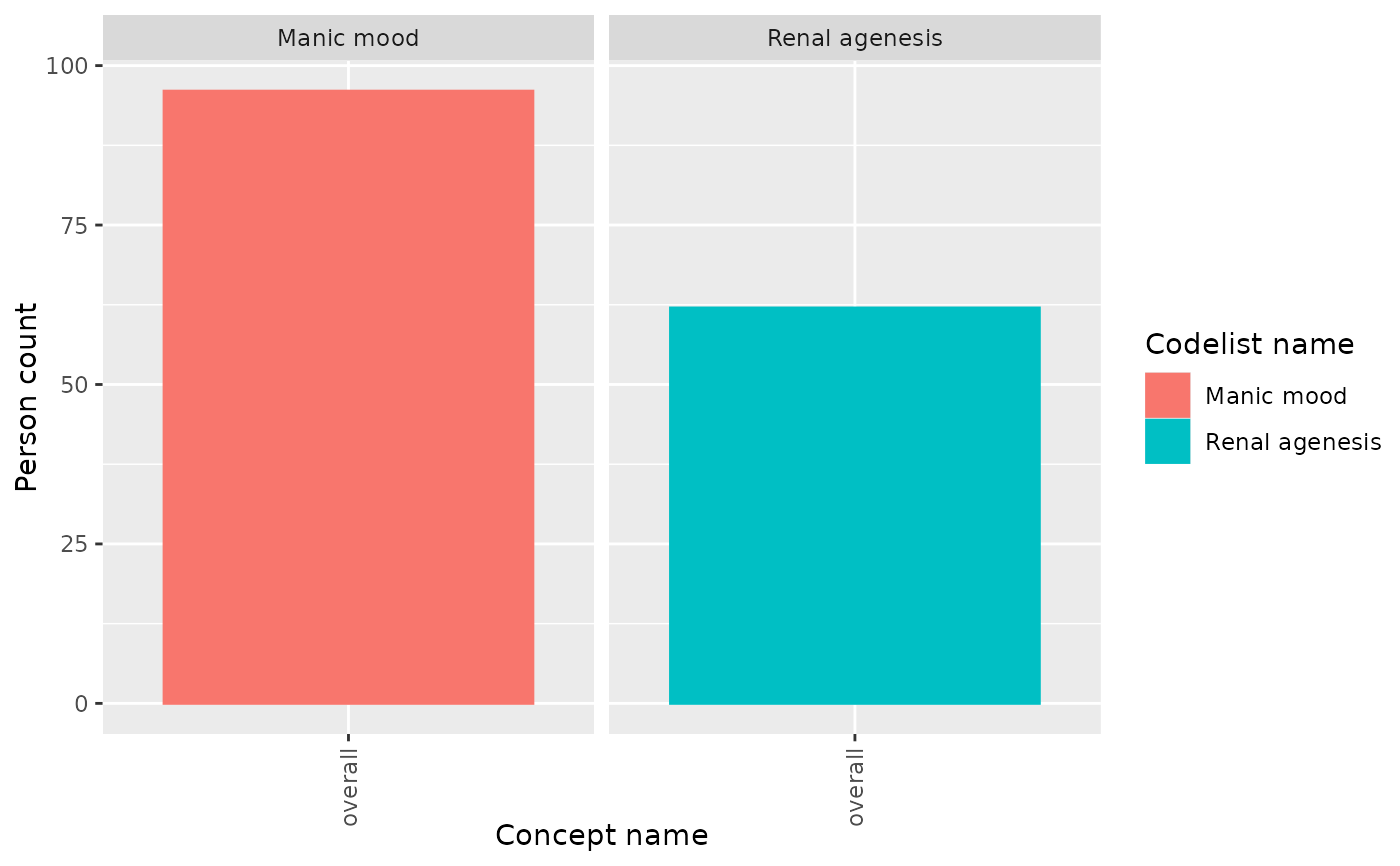
result |>
filter(variable_name == "Number subjects") |>
plotConceptCounts(facet = "codelist_name", colour = "standard_concept_name")
 PatientProfiles::mockDisconnect(cdm)
# }
PatientProfiles::mockDisconnect(cdm)
# }