Create a visual table from a summariseObservationPeriod() result
Source:R/tableObservationPeriod.R
tableObservationPeriod.RdCreate a visual table from a summariseObservationPeriod() result
Usage
tableObservationPeriod(
  result,
  header = "cdm_name",
  hide = omopgenerics::settingsColumns(result),
  groupColumn = omopgenerics::strataColumns(result),
  type = NULL,
  style = NULL
)
Arguments
- result
A summarised_result object (output of
summariseObservationPeriod()).- header
A vector specifying the elements to include in the header. The order of elements matters, with the first being the topmost header.
- hide
Columns to drop from the output table.
- groupColumn
Columns to use as group labels, to see options use visOmopResults::tableColumns(result).
- type
Character string specifying the desired output table format. See
visOmopResults::tableType()for supported table types. Iftype = NULL, global options (set viavisOmopResults::setGlobalTableOptions()) will be used if available; otherwise, a default 'gt' table is created.- style
Defines the visual formatting of the table. This argument can be provided in one of the following ways:
Pre-defined style: Use the name of a built-in style (e.g., "darwin"). See
visOmopResults::tableStyle()for available options.YAML file path: Provide the path to an existing .yml file defining a new style.
List of custome R code: Supply a block of custom R code or a named list describing styles for each table section. This code must be specific to the selected table type.
If
style = NULL, the function will use global options (seevisOmopResults::setGlobalTableOptions()) or a _brand.yml file (if found); otherwise, the default style is applied.
Examples
# \donttest{
library(OmopSketch)
library(dplyr, warn.conflicts = FALSE)
library(omock)
cdm <- mockCdmFromDataset(datasetName = "GiBleed", source = "duckdb")
#> ℹ Loading bundled GiBleed tables from package data.
#> ℹ Adding drug_strength table.
#> ℹ Creating local <cdm_reference> object.
#> ℹ Inserting <cdm_reference> into duckdb.
result <- summariseObservationPeriod(cdm = cdm)
#> Warning: ! There are 2649 individuals not included in the person table.
tableObservationPeriod(result = result)
Summary of observation_period table
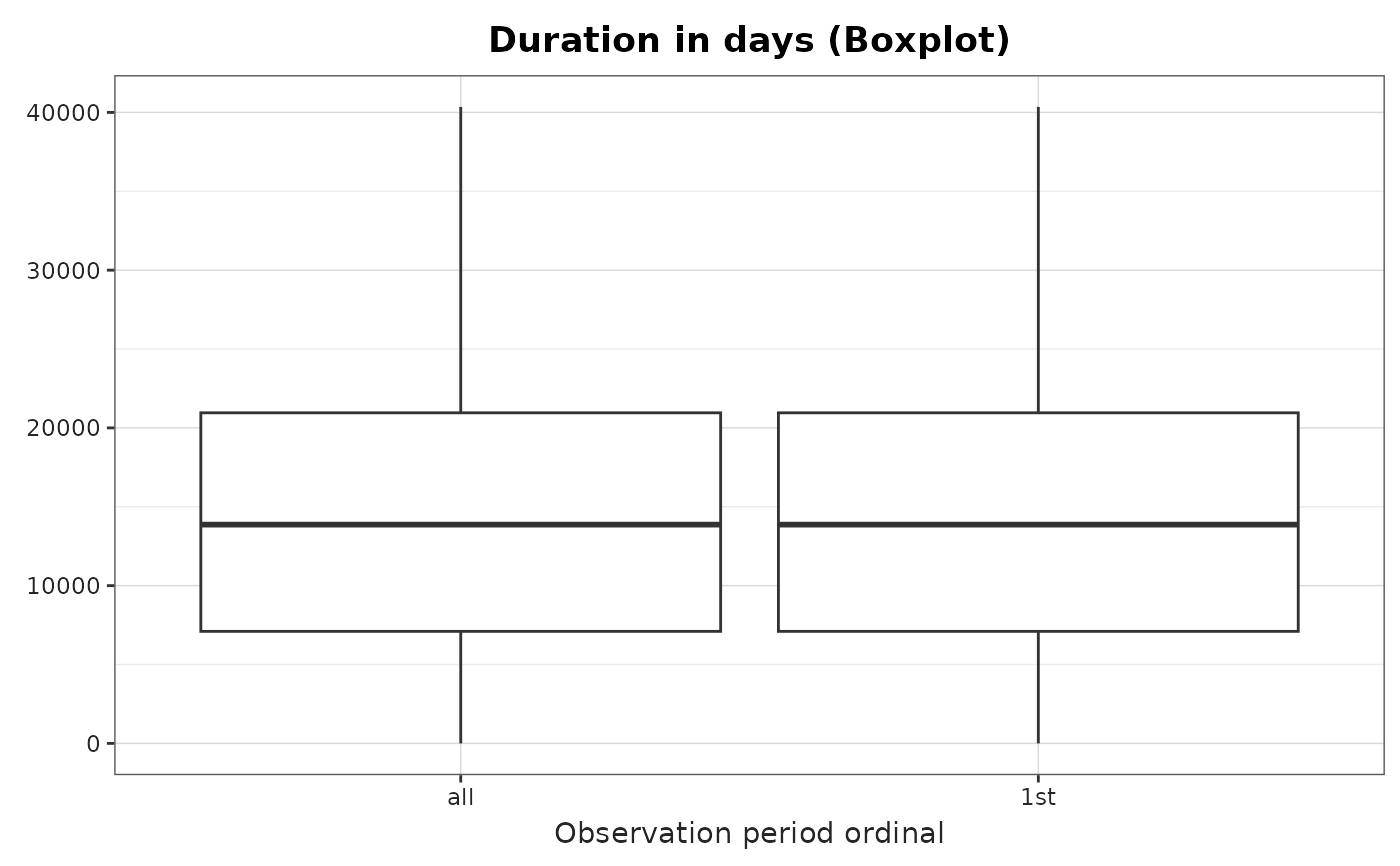
plotObservationPeriod(
result = result,
variableName = "Duration in days",
plotType = "boxplot"
)
 cdmDisconnect(cdm = cdm)
# }
cdmDisconnect(cdm = cdm)
# }