Cohort diagnostics
a03_CohortDiagnostics.RmdIntroduction
In this example we’re going to summarise cohort diagnostics results for cohorts of individuals with an ankle sprain, ankle fracture, forearm fracture, or a hip fracture using the Eunomia synthetic data.
Again, we’ll begin by creating our study cohorts.
library(CDMConnector)
library(CohortConstructor)
library(CodelistGenerator)
library(PatientProfiles)
library(CohortCharacteristics)
library(PhenotypeR)
library(dplyr)
library(ggplot2)

con <- DBI::dbConnect(duckdb::duckdb(),
                      CDMConnector::eunomiaDir("synpuf-1k", "5.3"))
cdm <- CDMConnector::cdmFromCon(con = con,
                                cdmName = "Eunomia Synpuf",
                                cdmSchema   = "main",
                                writeSchema = "main",
                                achillesSchema = "main")

cdm$injuries <- conceptCohort(cdm = cdm,
  conceptSet = list(
    "ankle_sprain" = 81151,
    "ankle_fracture" = 4059173,
    "forearm_fracture" = 4278672,
    "hip_fracture" = 4230399
  ),
  name = "injuries")
Cohort diagnostics
We can run cohort diagnostics analyses for each of our overall cohorts like so:
cohort_diag <- cohortDiagnostics(cdm$injuries)Our results will include a summary of the overlap between our cohorts. We could visualise this
plotCohortOverlap(cohort_diag, uniqueCombinations = TRUE)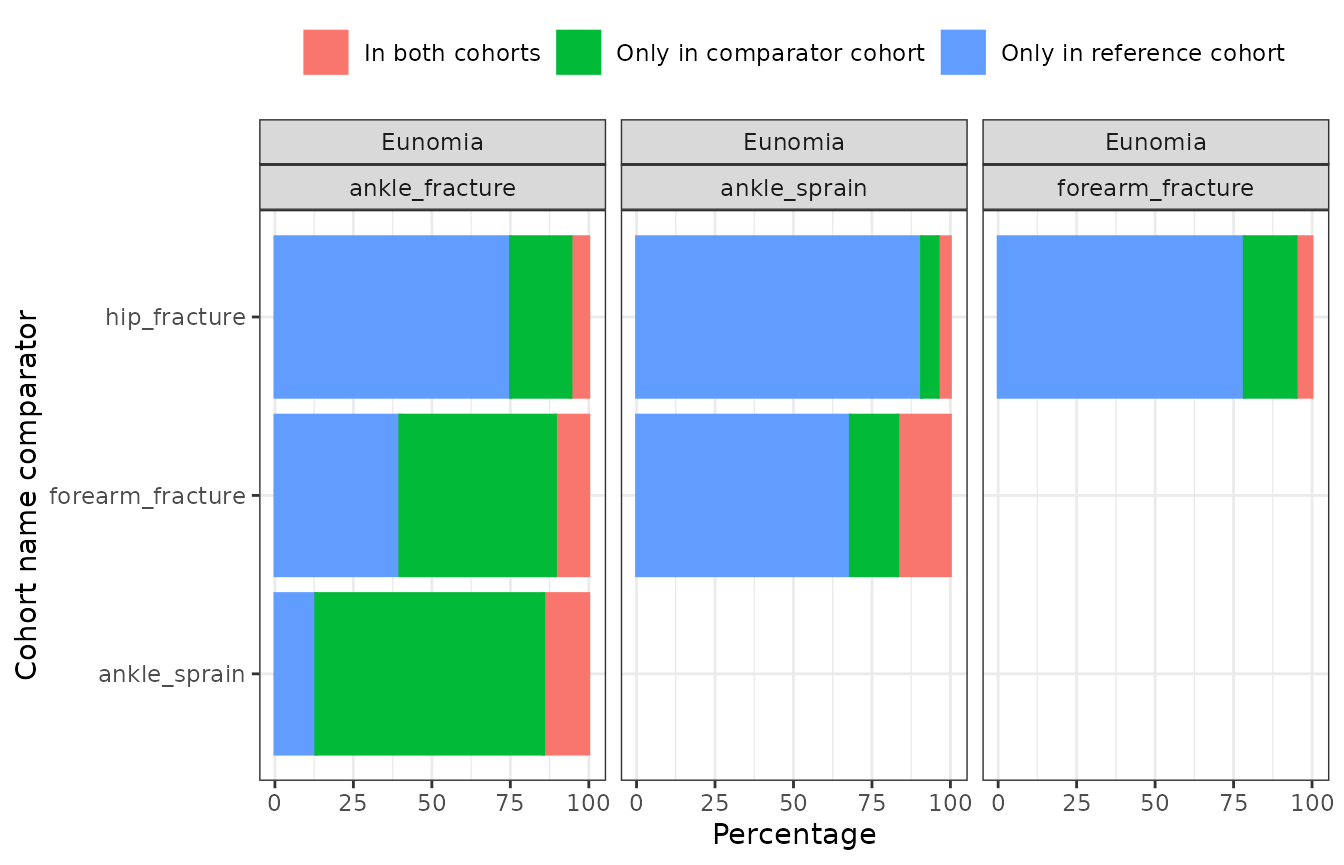
Moreover, our results will also include a summary of the characteristics of each cohort, stratified by age group and sex.
tableCharacteristics(cohort_diag, groupColumn = c("age_group", "sex"))|
CDM name
|
||||||
|---|---|---|---|---|---|---|
|
Eunomia Synpuf
|
||||||
| Variable name | Variable level | Estimate name |
Cohort name
|
|||
| ankle_fracture | ankle_sprain | forearm_fracture | hip_fracture | |||
| overall; overall | ||||||
| number subjects | - | N | 0 | 0 | 0 | 0 |
| number records | - | N | 0 | 0 | 0 | 0 |
| Number records | - | N | - | 28 | - | - |
| Number subjects | - | N | - | 27 | - | - |
| Cohort start date | - | Median [Q25 - Q75] | - | 2009-04-23 [2008-10-30 - 2010-02-02] | - | - |
| Range | - | 2008-01-10 to 2010-09-13 | - | - | ||
| Cohort end date | - | Median [Q25 - Q75] | - | 2009-04-24 [2008-10-30 - 2010-02-02] | - | - |
| Range | - | 2008-01-10 to 2010-09-13 | - | - | ||
| Age | - | Median [Q25 - Q75] | - | 72 [66 - 77] | - | - |
| Mean (SD) | - | 71.14 (15.68) | - | - | ||
| Range | - | 27 to 98 | - | - | ||
| Sex | Female | N (%) | - | 11 (39.29%) | - | - |
| Male | N (%) | - | 17 (60.71%) | - | - | |
| Prior observation | - | Median [Q25 - Q75] | - | 478 [303 - 762] | - | - |
| Mean (SD) | - | 499.54 (296.82) | - | - | ||
| Range | - | 9 to 986 | - | - | ||
| Future observation | - | Median [Q25 - Q75] | - | 572 [280 - 768] | - | - |
| Mean (SD) | - | 575.89 (301.07) | - | - | ||
| Range | - | 109 to 1,086 | - | - | ||
| Days in cohort | - | Median [Q25 - Q75] | - | 1 [1 - 1] | - | - |
| Mean (SD) | - | 1.11 (0.42) | - | - | ||
| Range | - | 1 to 3 | - | - | ||
| Number visits prior year | - | Median [Q25 - Q75] | - | 31.00 [16.50 - 45.00] | - | - |
| Mean (SD) | - | 31.71 (20.36) | - | - | ||
| Range | - | 0.00 to 73.00 | - | - | ||
| 18 to 64; overall | ||||||
| Number records | - | N | - | 5 | - | - |
| Number subjects | - | N | - | 5 | - | - |
| Cohort start date | - | Median [Q25 - Q75] | - | 2009-09-08 [2009-01-19 - 2010-05-24] | - | - |
| Range | - | 2008-02-03 to 2010-06-19 | - | - | ||
| Cohort end date | - | Median [Q25 - Q75] | - | 2009-09-08 [2009-01-19 - 2010-05-24] | - | - |
| Range | - | 2008-02-03 to 2010-06-19 | - | - | ||
| Age | - | Median [Q25 - Q75] | - | 44 [43 - 56] | - | - |
| Mean (SD) | - | 46.60 (13.79) | - | - | ||
| Range | - | 27 to 63 | - | - | ||
| Sex | Female | N (%) | - | 2 (40.00%) | - | - |
| Male | N (%) | - | 3 (60.00%) | - | - | |
| Prior observation | - | Median [Q25 - Q75] | - | 616 [384 - 874] | - | - |
| Mean (SD) | - | 561.40 (362.64) | - | - | ||
| Range | - | 33 to 900 | - | - | ||
| Future observation | - | Median [Q25 - Q75] | - | 479 [221 - 711] | - | - |
| Mean (SD) | - | 533.60 (362.64) | - | - | ||
| Range | - | 195 to 1,062 | - | - | ||
| Days in cohort | - | Median [Q25 - Q75] | - | 1 [1 - 1] | - | - |
| Mean (SD) | - | 1.00 (0.00) | - | - | ||
| Range | - | 1 to 1 | - | - | ||
| Number visits prior year | - | Median [Q25 - Q75] | - | 23.00 [5.00 - 26.00] | - | - |
| Mean (SD) | - | 20.20 (17.46) | - | - | ||
| Range | - | 2.00 to 45.00 | - | - | ||
| 65 to 150; overall | ||||||
| Number records | - | N | - | 23 | - | - |
| Number subjects | - | N | - | 22 | - | - |
| Cohort start date | - | Median [Q25 - Q75] | - | 2009-04-04 [2008-10-28 - 2009-12-27] | - | - |
| Range | - | 2008-01-10 to 2010-09-13 | - | - | ||
| Cohort end date | - | Median [Q25 - Q75] | - | 2009-04-05 [2008-10-28 - 2009-12-27] | - | - |
| Range | - | 2008-01-10 to 2010-09-13 | - | - | ||
| Age | - | Median [Q25 - Q75] | - | 75 [68 - 81] | - | - |
| Mean (SD) | - | 76.48 (10.03) | - | - | ||
| Range | - | 66 to 98 | - | - | ||
| Sex | Female | N (%) | - | 9 (39.13%) | - | - |
| Male | N (%) | - | 14 (60.87%) | - | - | |
| Prior observation | - | Median [Q25 - Q75] | - | 459 [302 - 726] | - | - |
| Mean (SD) | - | 486.09 (288.36) | - | - | ||
| Range | - | 9 to 986 | - | - | ||
| Future observation | - | Median [Q25 - Q75] | - | 598 [316 - 775] | - | - |
| Mean (SD) | - | 585.09 (294.69) | - | - | ||
| Range | - | 109 to 1,086 | - | - | ||
| Days in cohort | - | Median [Q25 - Q75] | - | 1 [1 - 1] | - | - |
| Mean (SD) | - | 1.13 (0.46) | - | - | ||
| Range | - | 1 to 3 | - | - | ||
| Number visits prior year | - | Median [Q25 - Q75] | - | 40.00 [20.50 - 47.00] | - | - |
| Mean (SD) | - | 34.22 (20.41) | - | - | ||
| Range | - | 0.00 to 73.00 | - | - | ||
| overall; Female | ||||||
| Number records | - | N | - | 11 | - | - |
| Number subjects | - | N | - | 11 | - | - |
| Cohort start date | - | Median [Q25 - Q75] | - | 2008-12-02 [2008-03-30 - 2009-04-11] | - | - |
| Range | - | 2008-01-10 to 2010-04-02 | - | - | ||
| Cohort end date | - | Median [Q25 - Q75] | - | 2008-12-04 [2008-03-30 - 2009-04-11] | - | - |
| Range | - | 2008-01-10 to 2010-04-02 | - | - | ||
| Age | - | Median [Q25 - Q75] | - | 70 [66 - 74] | - | - |
| Mean (SD) | - | 70.09 (12.28) | - | - | ||
| Range | - | 43 to 92 | - | - | ||
| Sex | Female | N (%) | - | 11 (100.00%) | - | - |
| Prior observation | - | Median [Q25 - Q75] | - | 336 [88 - 466] | - | - |
| Mean (SD) | - | 342.91 (288.53) | - | - | ||
| Range | - | 9 to 822 | - | - | ||
| Future observation | - | Median [Q25 - Q75] | - | 742 [415 - 1,006] | - | - |
| Mean (SD) | - | 702.27 (325.00) | - | - | ||
| Range | - | 249 to 1,086 | - | - | ||
| Days in cohort | - | Median [Q25 - Q75] | - | 1 [1 - 1] | - | - |
| Mean (SD) | - | 1.18 (0.60) | - | - | ||
| Range | - | 1 to 3 | - | - | ||
| Number visits prior year | - | Median [Q25 - Q75] | - | 28.00 [6.50 - 45.00] | - | - |
| Mean (SD) | - | 26.82 (20.58) | - | - | ||
| Range | - | 0.00 to 51.00 | - | - | ||
| overall; Male | ||||||
| Number records | - | N | - | 17 | - | - |
| Number subjects | - | N | - | 16 | - | - |
| Cohort start date | - | Median [Q25 - Q75] | - | 2009-10-08 [2009-01-03 - 2010-04-17] | - | - |
| Range | - | 2008-03-21 to 2010-09-13 | - | - | ||
| Cohort end date | - | Median [Q25 - Q75] | - | 2009-10-08 [2009-01-03 - 2010-04-17] | - | - |
| Range | - | 2008-03-21 to 2010-09-13 | - | - | ||
| Age | - | Median [Q25 - Q75] | - | 75 [66 - 79] | - | - |
| Mean (SD) | - | 71.82 (17.88) | - | - | ||
| Range | - | 27 to 98 | - | - | ||
| Sex | Male | N (%) | - | 17 (100.00%) | - | - |
| Prior observation | - | Median [Q25 - Q75] | - | 646 [368 - 837] | - | - |
| Mean (SD) | - | 600.88 (262.41) | - | - | ||
| Range | - | 80 to 986 | - | - | ||
| Future observation | - | Median [Q25 - Q75] | - | 449 [258 - 727] | - | - |
| Mean (SD) | - | 494.12 (262.41) | - | - | ||
| Range | - | 109 to 1,015 | - | - | ||
| Days in cohort | - | Median [Q25 - Q75] | - | 1 [1 - 1] | - | - |
| Mean (SD) | - | 1.06 (0.24) | - | - | ||
| Range | - | 1 to 2 | - | - | ||
| Number visits prior year | - | Median [Q25 - Q75] | - | 34.00 [23.00 - 45.00] | - | - |
| Mean (SD) | - | 34.88 (20.18) | - | - | ||
| Range | - | 5.00 to 73.00 | - | - | ||
You can also visualise the age distribution:
tableCharacteristics(cohort_diag, groupColumn = c("age_group", "sex"))|
CDM name
|
||||||
|---|---|---|---|---|---|---|
|
Eunomia Synpuf
|
||||||
| Variable name | Variable level | Estimate name |
Cohort name
|
|||
| ankle_fracture | ankle_sprain | forearm_fracture | hip_fracture | |||
| overall; overall | ||||||
| number subjects | - | N | 0 | 0 | 0 | 0 |
| number records | - | N | 0 | 0 | 0 | 0 |
| Number records | - | N | - | 28 | - | - |
| Number subjects | - | N | - | 27 | - | - |
| Cohort start date | - | Median [Q25 - Q75] | - | 2009-04-23 [2008-10-30 - 2010-02-02] | - | - |
| Range | - | 2008-01-10 to 2010-09-13 | - | - | ||
| Cohort end date | - | Median [Q25 - Q75] | - | 2009-04-24 [2008-10-30 - 2010-02-02] | - | - |
| Range | - | 2008-01-10 to 2010-09-13 | - | - | ||
| Age | - | Median [Q25 - Q75] | - | 72 [66 - 77] | - | - |
| Mean (SD) | - | 71.14 (15.68) | - | - | ||
| Range | - | 27 to 98 | - | - | ||
| Sex | Female | N (%) | - | 11 (39.29%) | - | - |
| Male | N (%) | - | 17 (60.71%) | - | - | |
| Prior observation | - | Median [Q25 - Q75] | - | 478 [303 - 762] | - | - |
| Mean (SD) | - | 499.54 (296.82) | - | - | ||
| Range | - | 9 to 986 | - | - | ||
| Future observation | - | Median [Q25 - Q75] | - | 572 [280 - 768] | - | - |
| Mean (SD) | - | 575.89 (301.07) | - | - | ||
| Range | - | 109 to 1,086 | - | - | ||
| Days in cohort | - | Median [Q25 - Q75] | - | 1 [1 - 1] | - | - |
| Mean (SD) | - | 1.11 (0.42) | - | - | ||
| Range | - | 1 to 3 | - | - | ||
| Number visits prior year | - | Median [Q25 - Q75] | - | 31.00 [16.50 - 45.00] | - | - |
| Mean (SD) | - | 31.71 (20.36) | - | - | ||
| Range | - | 0.00 to 73.00 | - | - | ||
| 18 to 64; overall | ||||||
| Number records | - | N | - | 5 | - | - |
| Number subjects | - | N | - | 5 | - | - |
| Cohort start date | - | Median [Q25 - Q75] | - | 2009-09-08 [2009-01-19 - 2010-05-24] | - | - |
| Range | - | 2008-02-03 to 2010-06-19 | - | - | ||
| Cohort end date | - | Median [Q25 - Q75] | - | 2009-09-08 [2009-01-19 - 2010-05-24] | - | - |
| Range | - | 2008-02-03 to 2010-06-19 | - | - | ||
| Age | - | Median [Q25 - Q75] | - | 44 [43 - 56] | - | - |
| Mean (SD) | - | 46.60 (13.79) | - | - | ||
| Range | - | 27 to 63 | - | - | ||
| Sex | Female | N (%) | - | 2 (40.00%) | - | - |
| Male | N (%) | - | 3 (60.00%) | - | - | |
| Prior observation | - | Median [Q25 - Q75] | - | 616 [384 - 874] | - | - |
| Mean (SD) | - | 561.40 (362.64) | - | - | ||
| Range | - | 33 to 900 | - | - | ||
| Future observation | - | Median [Q25 - Q75] | - | 479 [221 - 711] | - | - |
| Mean (SD) | - | 533.60 (362.64) | - | - | ||
| Range | - | 195 to 1,062 | - | - | ||
| Days in cohort | - | Median [Q25 - Q75] | - | 1 [1 - 1] | - | - |
| Mean (SD) | - | 1.00 (0.00) | - | - | ||
| Range | - | 1 to 1 | - | - | ||
| Number visits prior year | - | Median [Q25 - Q75] | - | 23.00 [5.00 - 26.00] | - | - |
| Mean (SD) | - | 20.20 (17.46) | - | - | ||
| Range | - | 2.00 to 45.00 | - | - | ||
| 65 to 150; overall | ||||||
| Number records | - | N | - | 23 | - | - |
| Number subjects | - | N | - | 22 | - | - |
| Cohort start date | - | Median [Q25 - Q75] | - | 2009-04-04 [2008-10-28 - 2009-12-27] | - | - |
| Range | - | 2008-01-10 to 2010-09-13 | - | - | ||
| Cohort end date | - | Median [Q25 - Q75] | - | 2009-04-05 [2008-10-28 - 2009-12-27] | - | - |
| Range | - | 2008-01-10 to 2010-09-13 | - | - | ||
| Age | - | Median [Q25 - Q75] | - | 75 [68 - 81] | - | - |
| Mean (SD) | - | 76.48 (10.03) | - | - | ||
| Range | - | 66 to 98 | - | - | ||
| Sex | Female | N (%) | - | 9 (39.13%) | - | - |
| Male | N (%) | - | 14 (60.87%) | - | - | |
| Prior observation | - | Median [Q25 - Q75] | - | 459 [302 - 726] | - | - |
| Mean (SD) | - | 486.09 (288.36) | - | - | ||
| Range | - | 9 to 986 | - | - | ||
| Future observation | - | Median [Q25 - Q75] | - | 598 [316 - 775] | - | - |
| Mean (SD) | - | 585.09 (294.69) | - | - | ||
| Range | - | 109 to 1,086 | - | - | ||
| Days in cohort | - | Median [Q25 - Q75] | - | 1 [1 - 1] | - | - |
| Mean (SD) | - | 1.13 (0.46) | - | - | ||
| Range | - | 1 to 3 | - | - | ||
| Number visits prior year | - | Median [Q25 - Q75] | - | 40.00 [20.50 - 47.00] | - | - |
| Mean (SD) | - | 34.22 (20.41) | - | - | ||
| Range | - | 0.00 to 73.00 | - | - | ||
| overall; Female | ||||||
| Number records | - | N | - | 11 | - | - |
| Number subjects | - | N | - | 11 | - | - |
| Cohort start date | - | Median [Q25 - Q75] | - | 2008-12-02 [2008-03-30 - 2009-04-11] | - | - |
| Range | - | 2008-01-10 to 2010-04-02 | - | - | ||
| Cohort end date | - | Median [Q25 - Q75] | - | 2008-12-04 [2008-03-30 - 2009-04-11] | - | - |
| Range | - | 2008-01-10 to 2010-04-02 | - | - | ||
| Age | - | Median [Q25 - Q75] | - | 70 [66 - 74] | - | - |
| Mean (SD) | - | 70.09 (12.28) | - | - | ||
| Range | - | 43 to 92 | - | - | ||
| Sex | Female | N (%) | - | 11 (100.00%) | - | - |
| Prior observation | - | Median [Q25 - Q75] | - | 336 [88 - 466] | - | - |
| Mean (SD) | - | 342.91 (288.53) | - | - | ||
| Range | - | 9 to 822 | - | - | ||
| Future observation | - | Median [Q25 - Q75] | - | 742 [415 - 1,006] | - | - |
| Mean (SD) | - | 702.27 (325.00) | - | - | ||
| Range | - | 249 to 1,086 | - | - | ||
| Days in cohort | - | Median [Q25 - Q75] | - | 1 [1 - 1] | - | - |
| Mean (SD) | - | 1.18 (0.60) | - | - | ||
| Range | - | 1 to 3 | - | - | ||
| Number visits prior year | - | Median [Q25 - Q75] | - | 28.00 [6.50 - 45.00] | - | - |
| Mean (SD) | - | 26.82 (20.58) | - | - | ||
| Range | - | 0.00 to 51.00 | - | - | ||
| overall; Male | ||||||
| Number records | - | N | - | 17 | - | - |
| Number subjects | - | N | - | 16 | - | - |
| Cohort start date | - | Median [Q25 - Q75] | - | 2009-10-08 [2009-01-03 - 2010-04-17] | - | - |
| Range | - | 2008-03-21 to 2010-09-13 | - | - | ||
| Cohort end date | - | Median [Q25 - Q75] | - | 2009-10-08 [2009-01-03 - 2010-04-17] | - | - |
| Range | - | 2008-03-21 to 2010-09-13 | - | - | ||
| Age | - | Median [Q25 - Q75] | - | 75 [66 - 79] | - | - |
| Mean (SD) | - | 71.82 (17.88) | - | - | ||
| Range | - | 27 to 98 | - | - | ||
| Sex | Male | N (%) | - | 17 (100.00%) | - | - |
| Prior observation | - | Median [Q25 - Q75] | - | 646 [368 - 837] | - | - |
| Mean (SD) | - | 600.88 (262.41) | - | - | ||
| Range | - | 80 to 986 | - | - | ||
| Future observation | - | Median [Q25 - Q75] | - | 449 [258 - 727] | - | - |
| Mean (SD) | - | 494.12 (262.41) | - | - | ||
| Range | - | 109 to 1,015 | - | - | ||
| Days in cohort | - | Median [Q25 - Q75] | - | 1 [1 - 1] | - | - |
| Mean (SD) | - | 1.06 (0.24) | - | - | ||
| Range | - | 1 to 2 | - | - | ||
| Number visits prior year | - | Median [Q25 - Q75] | - | 34.00 [23.00 - 45.00] | - | - |
| Mean (SD) | - | 34.88 (20.18) | - | - | ||
| Range | - | 5.00 to 73.00 | - | - | ||