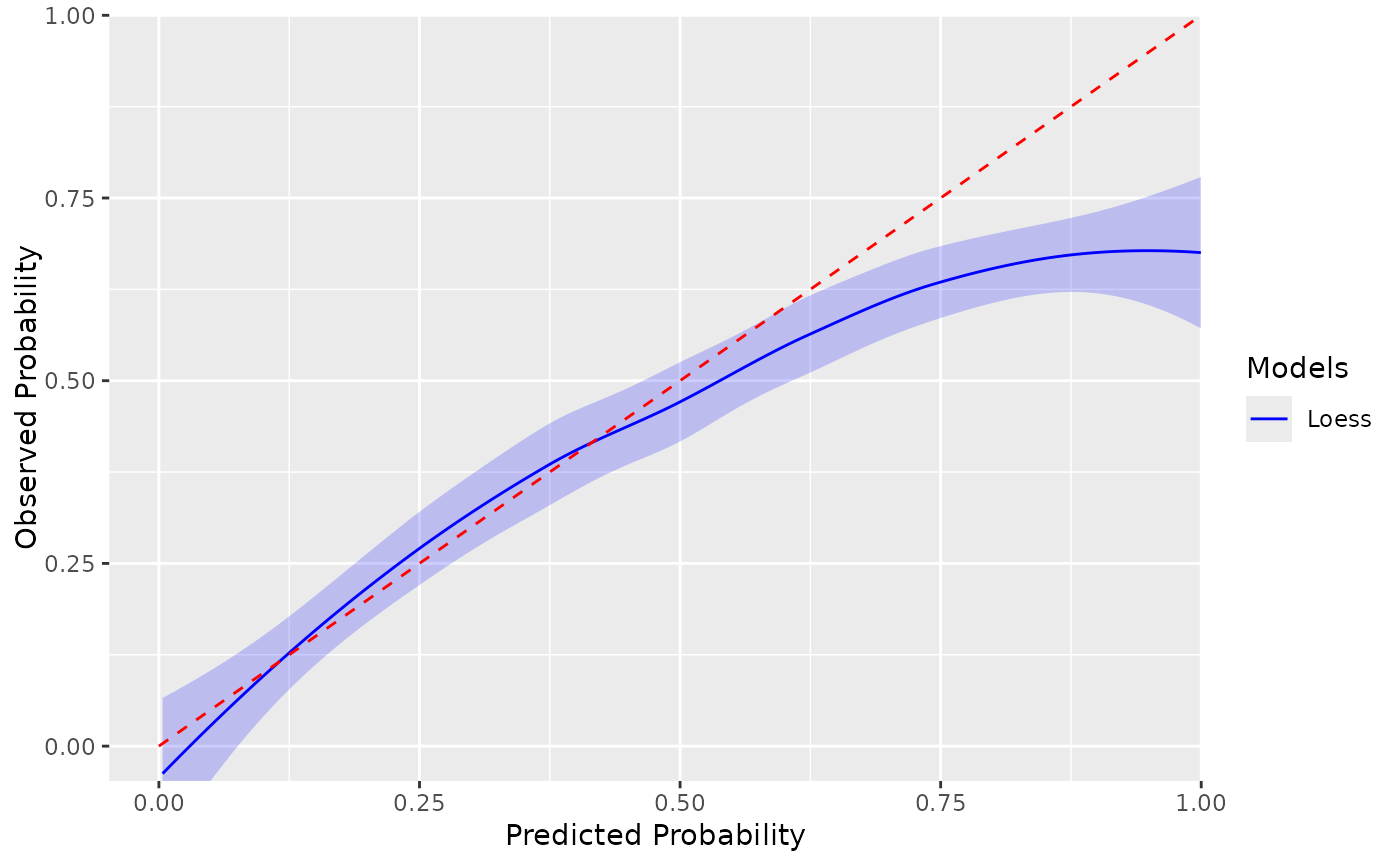
Plot the smooth calibration as detailed in Calster et al. "A calibration heirarchy for risk models was defined: from utopia to empirical data" (2016)
Source:R/Plotting.R
plotSmoothCalibration.RdPlot the smooth calibration as detailed in Calster et al. "A calibration heirarchy for risk models was defined: from utopia to empirical data" (2016)
Usage
plotSmoothCalibration(
  plpResult,
  smooth = "loess",
  span = 0.75,
  nKnots = 5,
  scatter = FALSE,
  bins = 20,
  sample = TRUE,
  typeColumn = "evaluation",
  saveLocation = NULL,
  fileName = "smoothCalibration.pdf"
)
Arguments
- plpResult
The result of running
runPlpfunction. An object containing the model or location where the model is save, the data selection settings, the preprocessing and training settings as well as various performance measures obtained by the model.- smooth
options: 'loess' or 'rcs'
- span
This specifies the width of span used for loess. This will allow for faster computing and lower memory usage.
- nKnots
The number of knots to be used by the rcs evaluation. Default is 5
- scatter
plot the decile calibrations as points on the graph. Default is False
- bins
The number of bins for the histogram. Default is 20.
- sample
If using loess then by default 20,000 patients will be sampled to save time
- typeColumn
The name of the column specifying the evaluation type
- saveLocation
Directory to save plot (if NULL plot is not saved)
- fileName
Name of the file to save to plot, for example 'plot.png'. See the function
ggsavein the ggplot2 package for supported file formats.
Examples
# generate prediction dataaframe with 1000 patients
predictedRisk <- stats::runif(1000)
# overconfident for high risk patients
actualRisk <- ifelse(predictedRisk < 0.5, predictedRisk, 0.5 + 0.5 * (predictedRisk - 0.5))
outcomeCount <- stats::rbinom(1000, 1, actualRisk)
# mock data frame
prediction <- data.frame(rowId = 1:1000,
value = predictedRisk,
outcomeCount = outcomeCount,
evaluationType = "Test")
attr(prediction, "modelType") <- "binary"
calibrationSummary <- getCalibrationSummary(prediction, "binary",
numberOfStrata = 10,
typeColumn = "evaluationType")
plpResults <- list()
plpResults$performanceEvaluation$calibrationSummary <- calibrationSummary
plpResults$prediction <- prediction
plotSmoothCalibration(plpResults)
#> Smooth calibration plot for Test
#> $test
#> $test$smoothPlot
 #>
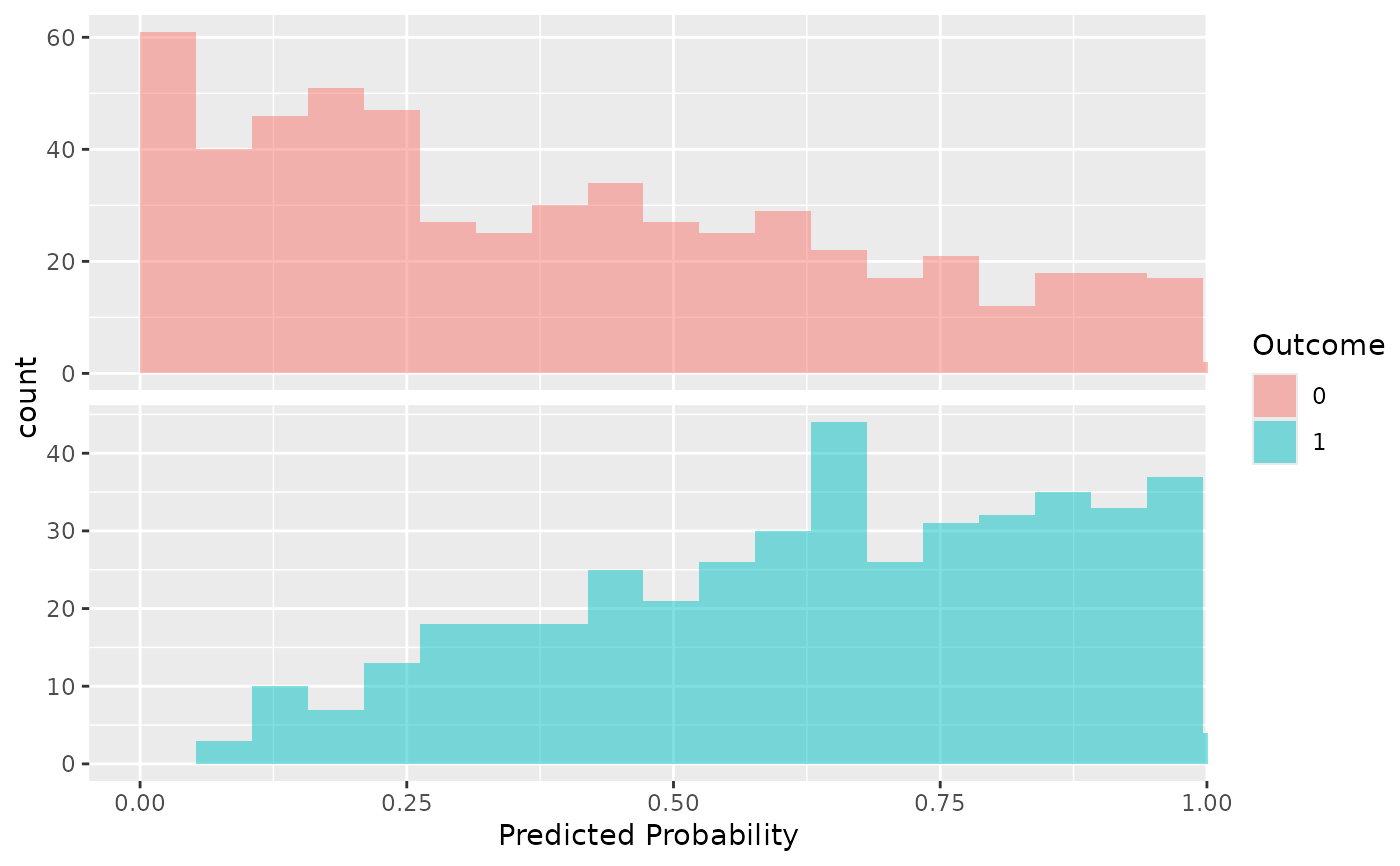
#> $test$histPlot
#>
#> $test$histPlot
 #>
#>
#>
#>