OHDSI 2025 ClinicalCharacteristics
Casey Tilton
Martin Lavallee
symposium_demo.RmdIntroduction
ClinicalCharacteristics allows users to summarize the
number of patients who are observed to have presence of a clinical event
during a time interval relative to the target cohort index date.
Currently the package only supports the use of “earliest event cohort”
where there is one cohort entry per patient.
For example, we might want to characterize a cohort by condition
occurrences that take place 30 to 365 days after index. However, we have
found there are different ways of summarizing the presence of an event
based on how we choose to apply a patient’s observation period and how
we evaluate presence of occurrences (i.e., based on the span of patient
time versus discrete start dates). Summarizing “presence of a clinical
event” can lead to very different results depending on the choices we
make in ClinicalCharacteristics.
This vignette present methods of characterizing events in a target population. First, we explain the difference between two different methods of counting patients in a cohort that experience a clinical event during a time interval: ‘Any Presence’ and ‘Observed Presence’. Second, we distinguish between summarizing covariate cohorts anchored on cohort start date versus cohort era overlap.
To demonstrate how to use the various methods of characterizing
events within ClinicalCharacterists, we perform an
experiment with a simple hypertension cohort. Finally, we visualize the
results to show how choices in methods lead to different counts of
patients.
Any vs Observed Presence
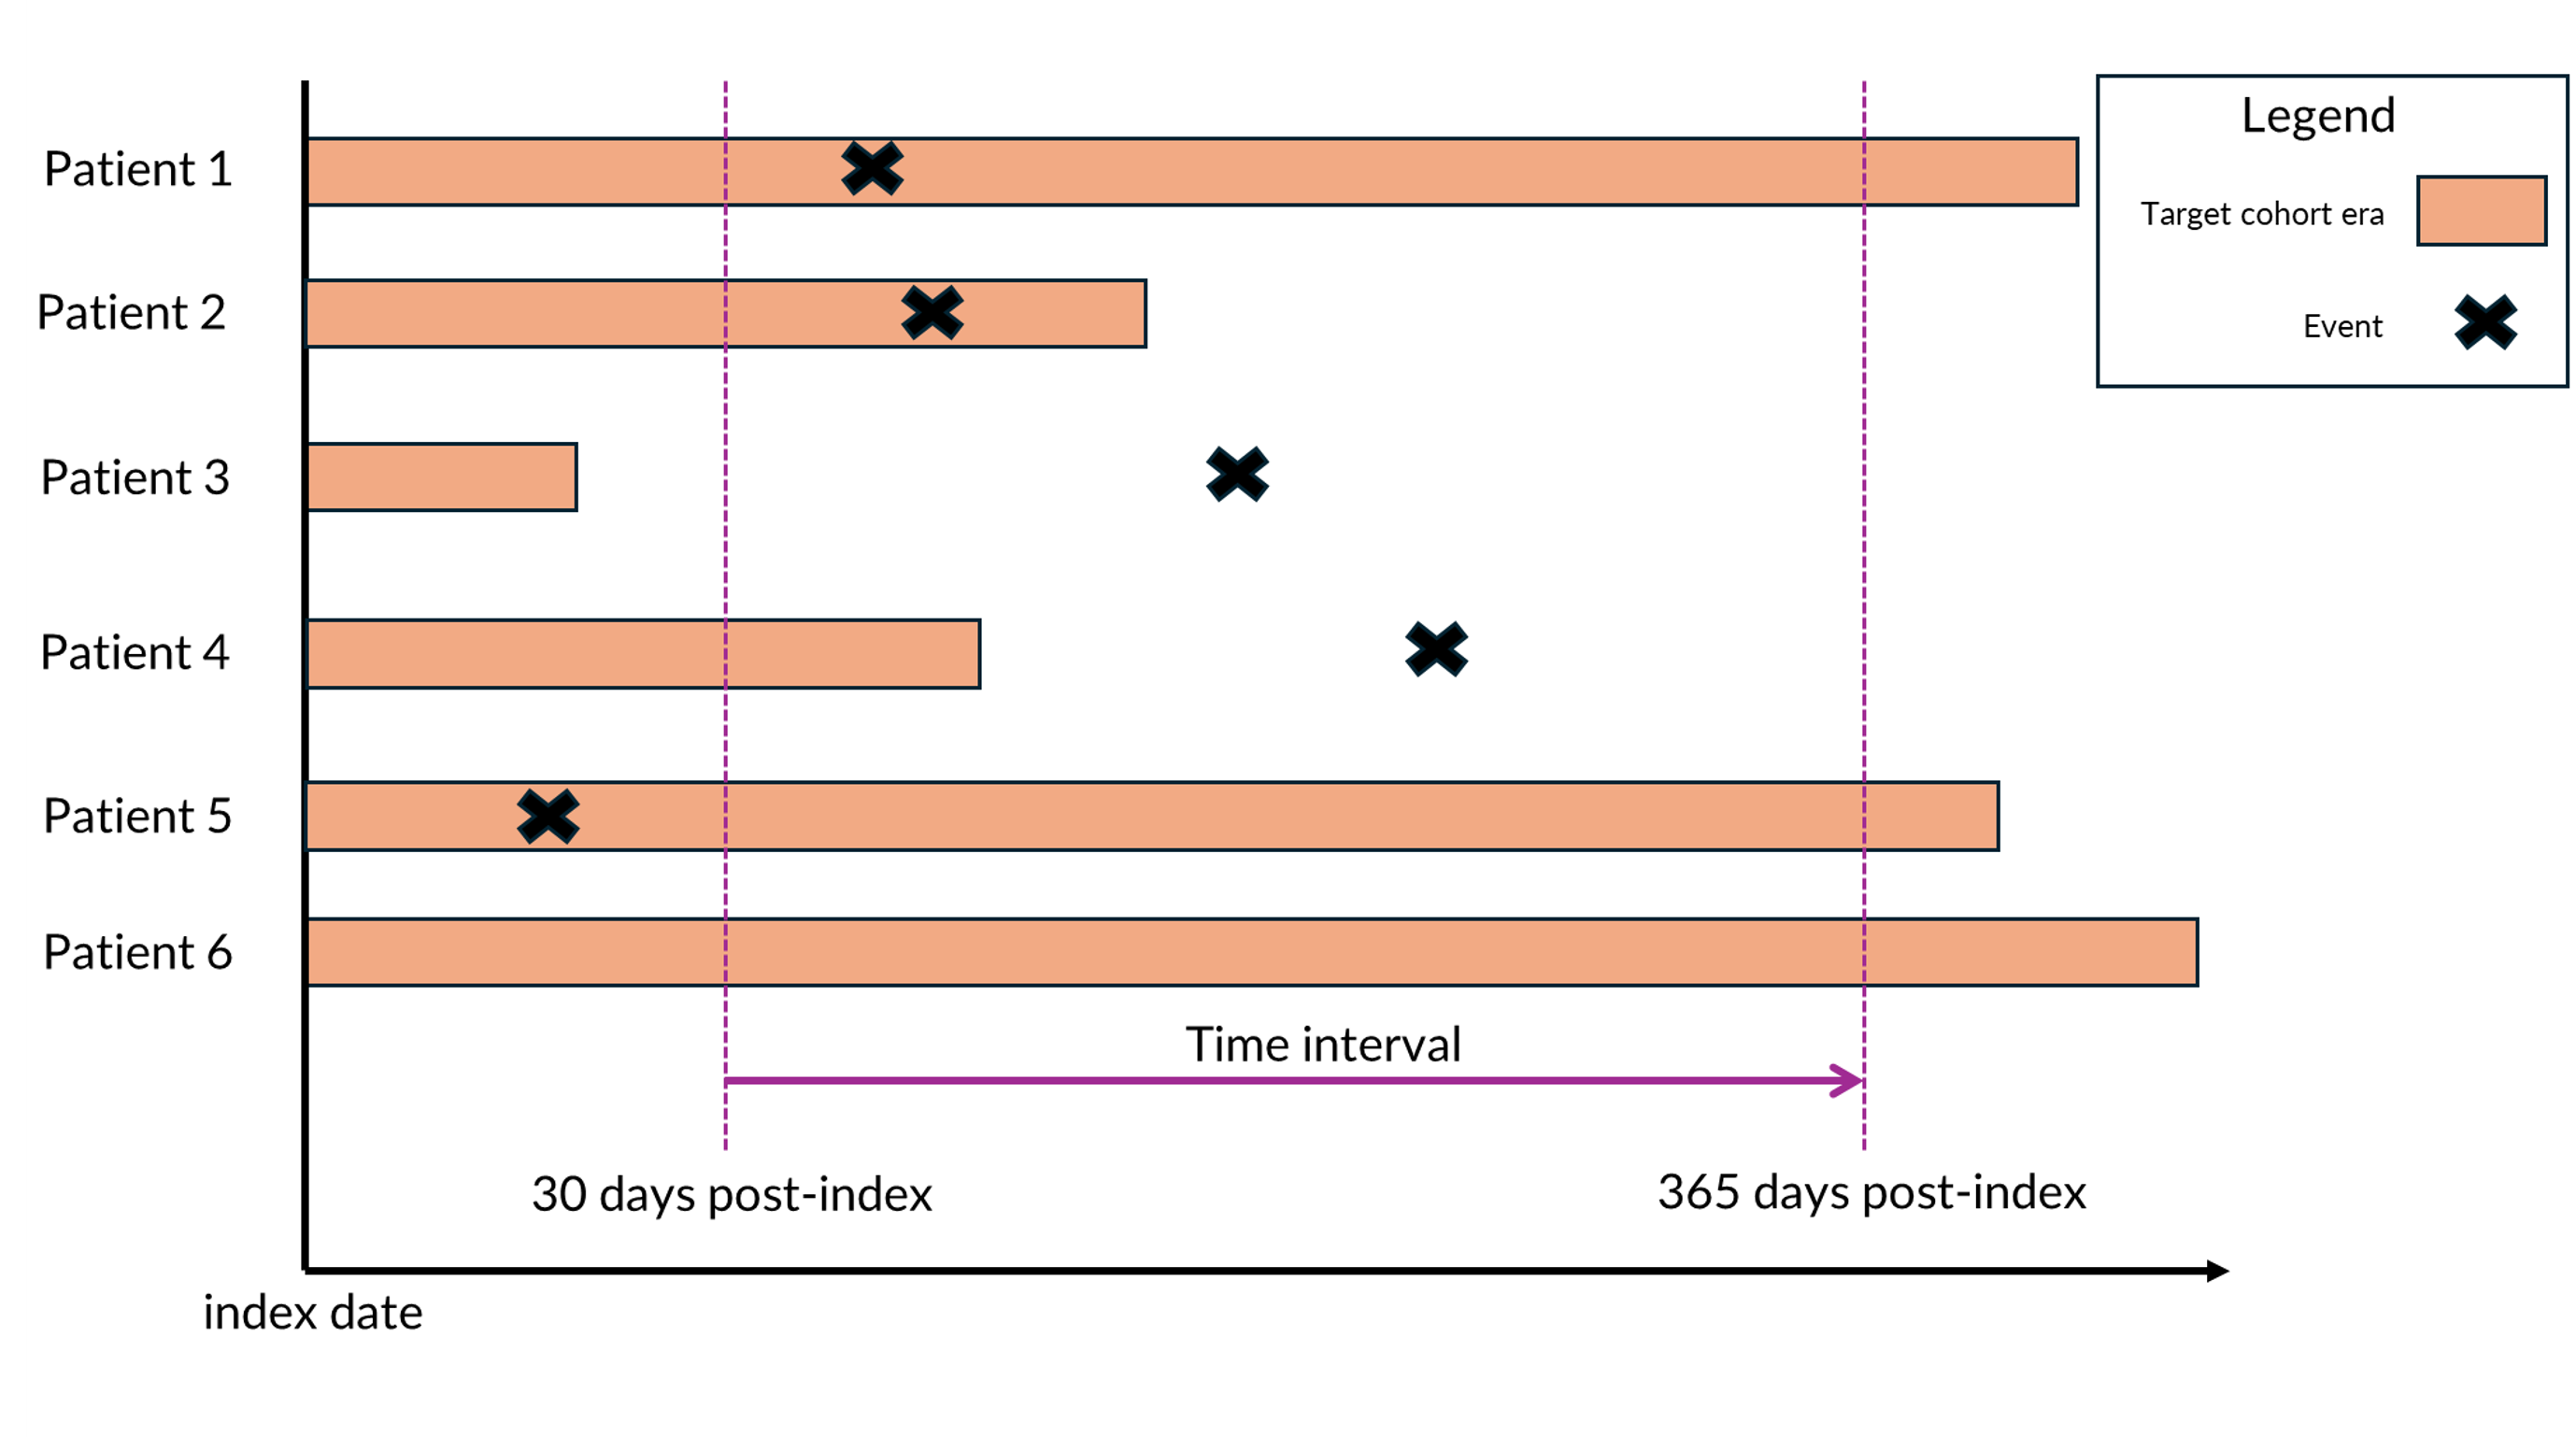
One option for counting the presence of clinical event is whether we
want to count “any” event or only “observed” events. “Observed” events
only count when the event has occurred within the specified time
interval and occur during the patient’s time in the cohort. “Any” events
count when the event has occurred within the specified time interval
regardless of the patient’s observation period. In both cases the
denominator for the percentage is the same — the number of persons in
the cohort of interest. Figure 1 shows an example to differentiate the
two methods. If using “any”, patients 1, 2, 3, and 4 are counted. If
using “observed” we exclude patients 3 and 4 from the count because the
event does not occur during the same observed time. We can configure
these different options in ClinicalCharacteristics
depending on which characterization is best suited for the study.
Setup
Creating target cohorts
First we use Capr to create a simple target cohort of
patients who have experienced at least one condition occurrence of
hypertension with a continuous observation window of 1 year prior to the
index date.
# create hypertenison concept set
htn_cs <- Capr::cs(Capr::descendants(320128), name = "Hypertension")

# create hypertension cohort
htn_cohort <- Capr::cohort(
  entry = Capr::entry(
    Capr::conditionOccurrence(conceptSet = htn_cs),
    observationWindow = Capr::continuousObservation(priorDays = 365L),
    primaryCriteriaLimit = "First"
  ),
  attrition = Capr::attrition(expressionLimit = "First"),
  exit = Capr::exit(
    endStrategy = Capr::observationExit()
  )
)
Creating drug usage covariate cohorts
Next we use Capr to create two drug exposure cohorts
using definitions from the Book
of OHDSI.
Ace Inhibitor usage covariate cohort
# create ace inhibitor concept set
ace_cs <- Capr::cs(
  Capr::descendants(1308216,1310756,1331235,1334456,1335471,1340128,1341927,1342439,1363749,1373225),
  name = "Ace Inhibitor Usage"
)

# create ace inhibitor cohort
ace_use_cohort <- Capr::cohort(
  entry = Capr::entry(
    Capr::drugExposure(conceptSet = ace_cs),
    observationWindow = Capr::continuousObservation(priorDays = 0L),
    primaryCriteriaLimit = "First"
  ),
  attrition = Capr::attrition(expressionLimit = "First"),
  exit = Capr::exit(
    endStrategy = Capr::drugExit(conceptSet = ace_cs)
  )
)
Angiotensin Receptor Blockers (ARB) usage covariate cohort
# create arb concept set
arb_cs <- Capr::cs(
  Capr::descendants(1308842,1317640,1346686,1347384,
                    1351557,1367500,40226742,40235485),
  name = "ARB Usage"
)

# create arb cohort
arb_use_cohort <- Capr::cohort(
  entry = Capr::entry(
    Capr::drugExposure(conceptSet = arb_cs),
    observationWindow = Capr::continuousObservation(priorDays = 0L),
    primaryCriteriaLimit = "First"
  ),
  attrition = Capr::attrition(expressionLimit = "First"),
  exit = Capr::exit(
    endStrategy = Capr::drugExit(conceptSet = arb_cs)
  )
)
Create a definition set dataframe for the three cohorts
Next, we combine the cohort definitions into a dataframe with
Capr::makeCohortSet.
cohortDefinitionSet <- Capr::makeCohortSet(htn_cohort, arb_use_cohort, ace_use_cohort)Connect to the database
To build these cohorts we must connect to our OMOP dbms and generate the set to a schema with write access. Replace the template below with your omop dbms credentials in order to continue with the vignette.
# provide connection details
connectionDetails <- DatabaseConnector::createConnectionDetails(
  dbms = "my_dbms",
  user = "my_user",
  password = "secret",
  connectionString = "connection_string"
)
# connect to database
connection <- DatabaseConnector::connect(connectionDetails)
Generate cohorts
Next we use CohortGenerator to create an empty cohort
table in a scratch database schema that will be populated with patients
for the three cohorts in cohortDefinitionSet.
# find cohort table names
cohortTableNms <- CohortGenerator::getCohortTableNames(
  cohortTable = "study_cohort_table"
)


CohortGenerator::createCohortTables(
  connection = connection,
  cohortDatabaseSchema = executionSettings$workDatabaseSchema,
  cohortTableNames = cohortTableNms,
  incremental = TRUE
)

cohortsGenerated <- CohortGenerator::generateCohortSet(
  connection = connection,
  cdmDatabaseSchema = "my_cdm",
  cohortDatabaseSchema = "my_cohorts",
  cohortTableNames = cohortTableNms,
  cohortDefinitionSet = cohortDefinitionSet,
  tempEmulationSchema = "temp_schema"
)
How to use ClinicalCharacteristics
In this section we will demonstrate how to use Clinical Characteristics to characterize our hypertension cohort. This section will review the syntax required to prepare the table shell object and then generate.
Experiment 1
In our first experiment we will look at the difference between any and observed count when characterizing the Hypertension cohort. To run this experiment we need to:
- identify the cohorts and concept sets used for the characterization
- define our time intervals for analysis
- set up our execution settings and build options to run the characterization
- build the table shell
- generate the results
Preparing the table shell
First we set up the assets use for the characterization. Our target cohort is Hypertension. Then we use concept sets of Chronic Kidney Disease, Heart Failure, and Coronary Artery Disease and add them to a list.
condition_cs_batch <- list(
  Capr::cs(Capr::descendants(46271022), name = "ckd"),
  Capr::cs(Capr::descendants(316139), name = "hf"),
  Capr::cs(Capr::descendants(35205164), name = "cad")
)
Finally we identify the cohort covariates we want to use for the characterization.
covariate_cohorts <- list(
  ClinicalCharacteristics::createCohortInfo(id = 2, name = "Ace Inhibitor Usage"),
  ClinicalCharacteristics::createCohortInfo(id = 3, name = "Angiotensin Receptor Blockers Usage")
  )
Next up, we define our time intervals of interest. We create a list of timeInterval objects with left and right bounds relative to the index date.
time_windows <- list(
  ClinicalCharacteristics::timeInterval(lb = -730, rb = -1),
  ClinicalCharacteristics::timeInterval(lb = -365, rb = -1),
  ClinicalCharacteristics::timeInterval(lb = 0, rb = 30),
  ClinicalCharacteristics::timeInterval(lb = 31, rb = 90),
  ClinicalCharacteristics::timeInterval(lb = 0, rb = 365),
  ClinicalCharacteristics::timeInterval(lb = 366, rb = 720),
  ClinicalCharacteristics::timeInterval(lb = 0, rb = 9999)
)
Next we set up the execution settings and build options for the analysis. Typically we use the default build options which uses a set of temp tables to evaluate the shell.
executionSettingsForClinChar <- ClinicalCharacteristics::createExecutionSettings(
    connectionDetails = connectionDetails,
    cdmDatabaseSchema = "my_cdm",
    workDatabaseSchema = "my_cohorts",
    tempEmulationSchema = "temp_schema",
    cohortTable = "study_cohort_table",
    cdmSourceName = "my_cdm_source"
  )

buildOps <- ClinicalCharacteristics::defaultTableShellBuildOptions()
Create a new table shell
Add the line items for the condition concept sets and drug covariate cohorts and set the statistic parameter equal to anyPresenceStat() or ObservedPresenceStat(). In this case we create line item batches for anyPresenceStat() and ObservedPresenceStat() to compare the differences in the number of patients counted using each method.
ts <- ClinicalCharacteristics::createTableShell(
  title = " Hypertension Experiment 1",
  targetCohorts = list(
    ClinicalCharacteristics::createCohortInfo(id = 1, name = "Hypertension")
    ),
  lineItems = ClinicalCharacteristics::lineItems(
    ClinicalCharacteristics::addDefaultGenderLineItems(),
    ClinicalCharacteristics::addDefaultEthnicityLineItems(),
    ClinicalCharacteristics::createDemographicLineItem(
      ClinicalCharacteristics::raceCategory()
      ),
    ClinicalCharacteristics::createDemographicLineItem(
      ClinicalCharacteristics::ageCharCts()
      ),
    ClinicalCharacteristics::createDemographicLineItem(
      ClinicalCharacteristics::ageCharBreaks(
        breaks = ClinicalCharacteristics::age5yrGrp()
        )
      ),
    ClinicalCharacteristics::createConceptSetLineItemBatch(
      sectionLabel = "Conditions Any Presence",
      domain = "condition_occurrence",
      statistic = ClinicalCharacteristics::anyPresenceStat(),
      conceptSets = condition_cs_batch,
      timeIntervals = time_windows
    ),
    ClinicalCharacteristics::createConceptSetLineItemBatch(
      sectionLabel = "Conditions Observed Presence",
      domain = "condition_occurrence",
      statistic = ClinicalCharacteristics::observedPresenceStat(),
      conceptSets = condition_cs_batch,
      timeIntervals = time_windows
    ),
    ClinicalCharacteristics::createCohortLineItemBatch(
      sectionLabel = "Drug Cohorts Any Presence",
      covariateCohorts = covariate_cohorts,
      cohortTable = executionSettings$cohortTable,
      timeIntervals = time_windows,
      statistic = ClinicalCharacteristics::anyPresenceStat()
    ),
    ClinicalCharacteristics::createCohortLineItemBatch(
      sectionLabel = "Drug Cohorts Observed Presence",
      covariateCohorts = covariate_cohorts,
      cohortTable = executionSettings$cohortTable,
      timeIntervals = time_windows,
      statistic = ClinicalCharacteristics::observedPresenceStat()
    )
  )
)
Once the the table shell is created, we will generate the table shell to extract our results.
res <- ClinicalCharacteristics::generateTableShell(
  tableShell = ts,
  executionSettings = executionSettingsForClinChar,
  buildOptions = buildOps
)
Experiment 2: Cohort Era vs Start Date
When characterizing a target cohort by covariate cohorts, we need to
determine whether we count an event as present within a time interval
using the cohort start date or any covariate cohort era overlap with the
interval. Recall that cohorts have an entry and exit date. For example,
a drug era cohort starts on the first exposure and persists based on
continuous exposure. With this logic, the exposure time is not limited
to the start date, but the duration of active exposure, and we want to
enumerate the presence of an event as such. With
FeatureExtraction, characterizing covariate cohorts can
only be done based on cohort era overlap, whereas
ClinicalCharacteristics provides options for both.
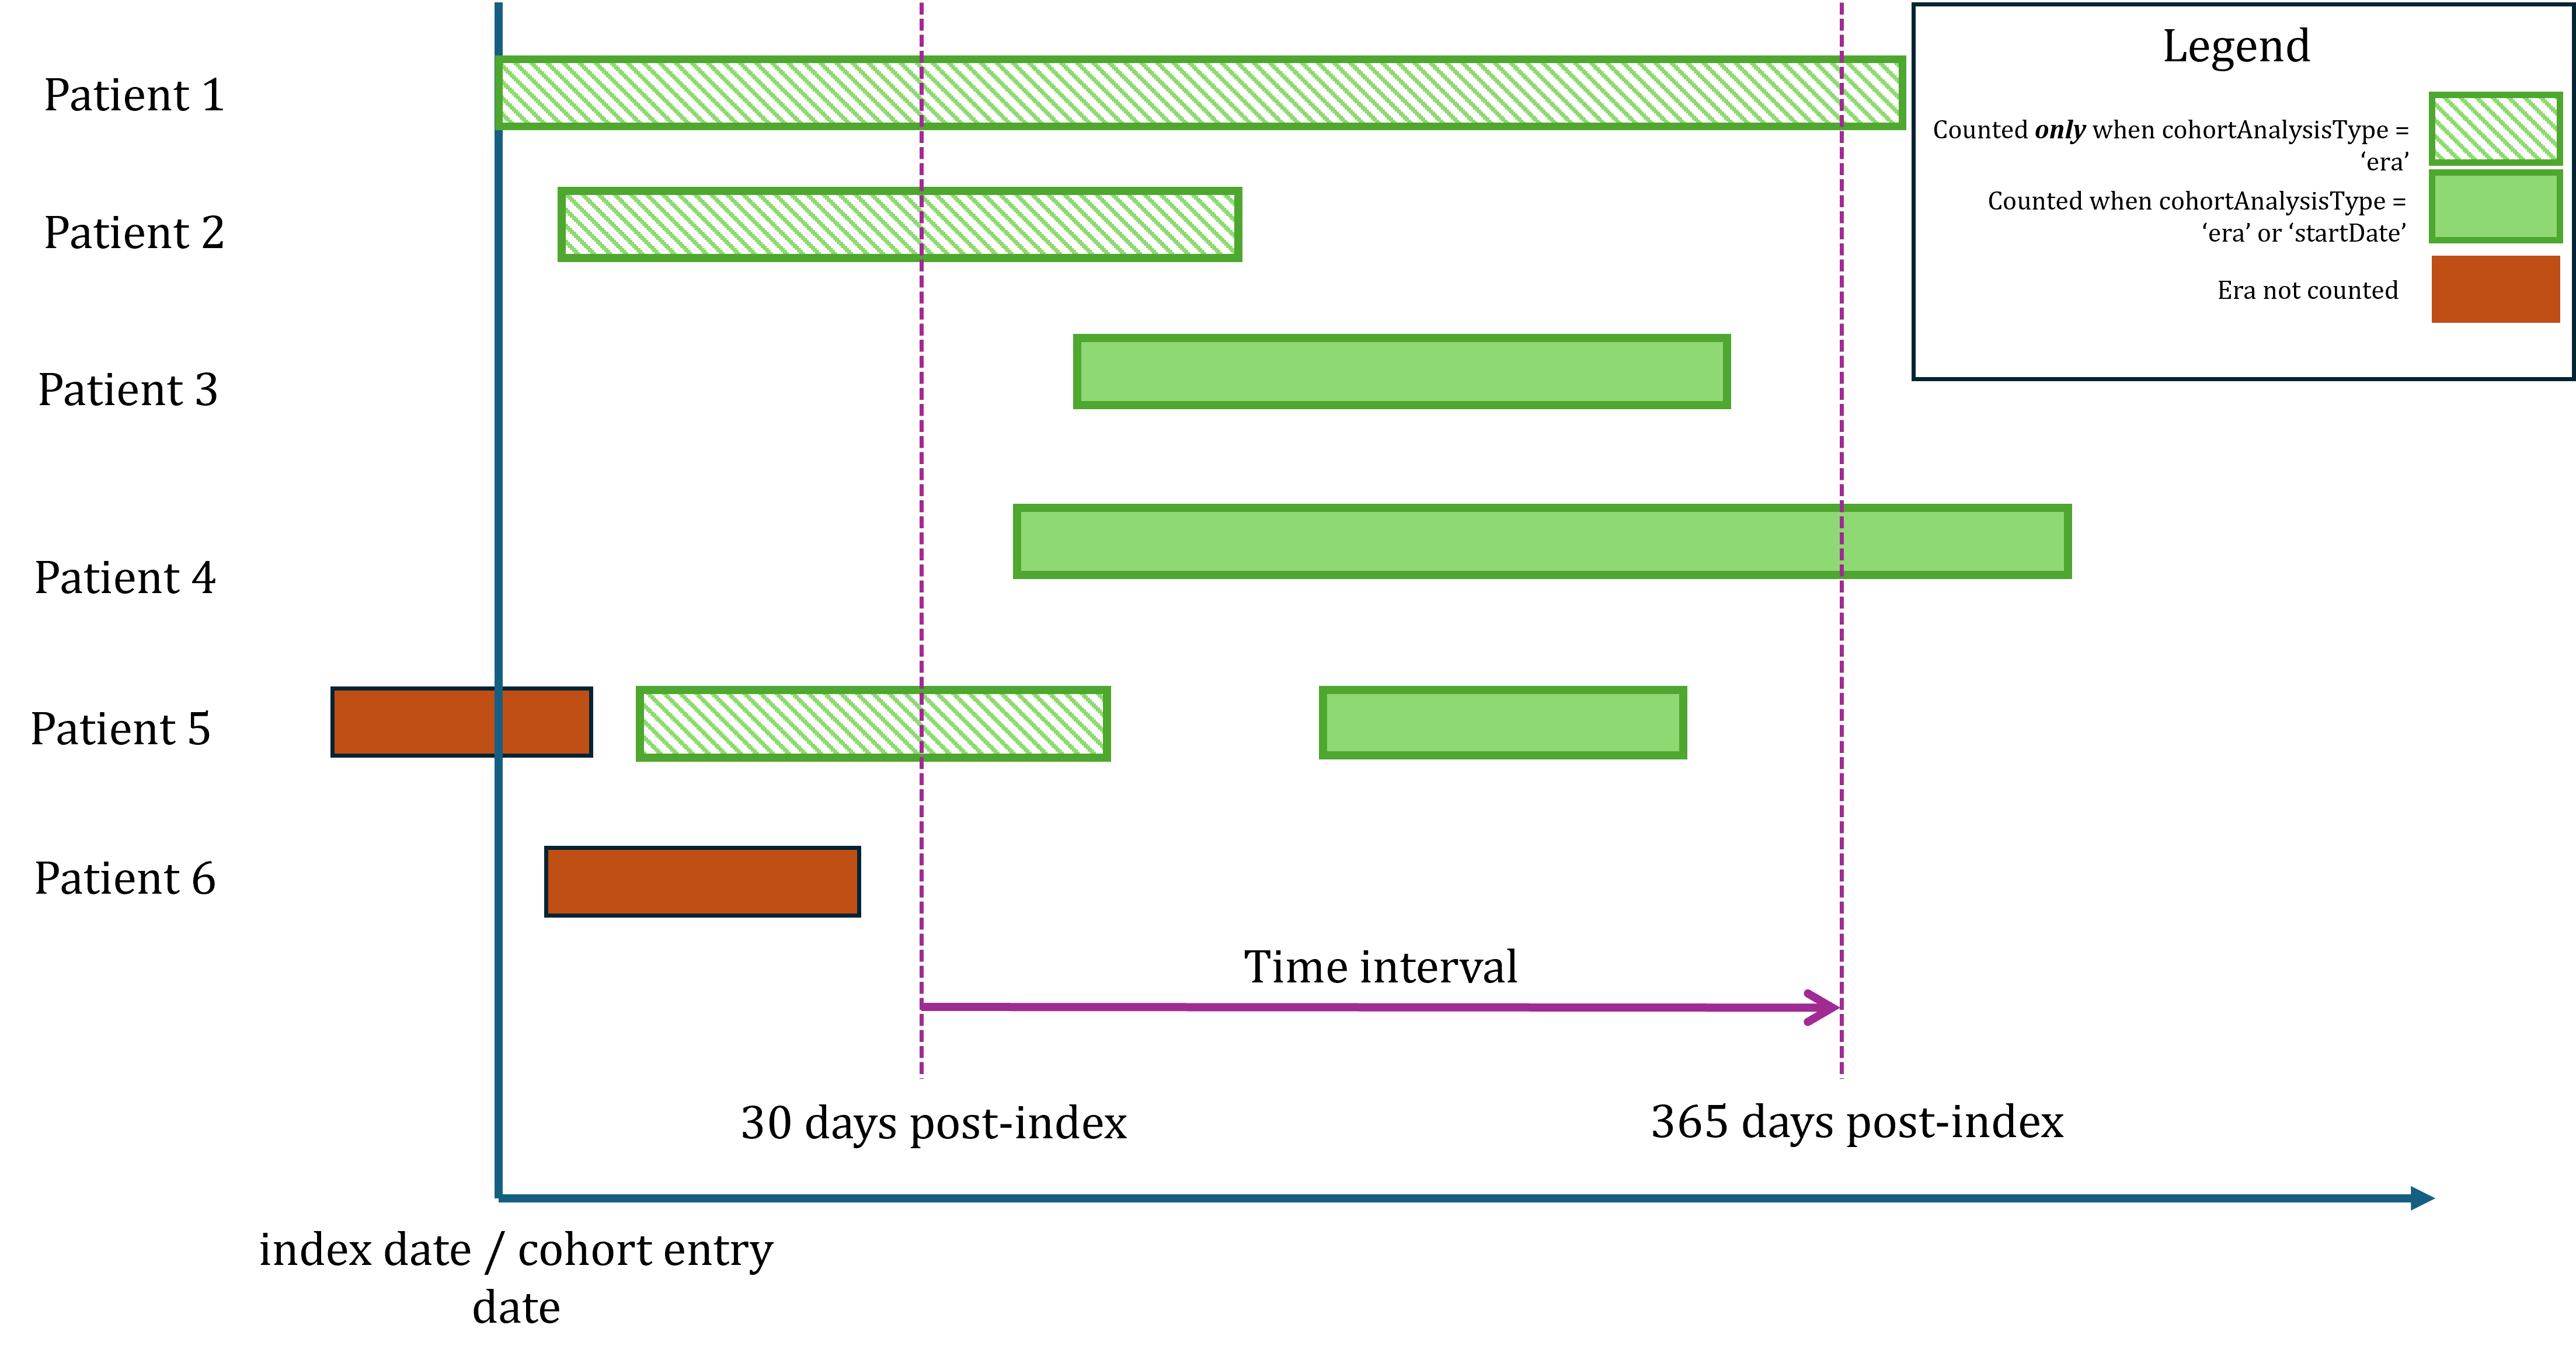
The figure below demonstrates the difference in enumerating patients based on the cohort era or the start date. Patients 3 and 4 have eras that start after the time interval start date so they would be counted using either analysis type. Patient 5 would qualify under either analysis type because they have an era that overlaps with the time interval start and an era that starts within the time interval. Patient 6 would not be counted by either method because the era does not overlap with the time interval.
To run this experiment, we create two buildOptions objects with the cohortAnalysisType parameter set to either “era” and “startDate”.
buildOptionsEra <- ClinicalCharacteristics::defaultTableShellBuildOptions(cohortAnalysisType = "era")
buildOptionsStartDate <- ClinicalCharacteristics::defaultTableShellBuildOptions(                          cohortAnalysisType = "startDate")
These two options set how we want to enumerate a cohort covariate in the characterization. As before we set up the table shell and generate the results.
ts_2 <- ClinicalCharacteristics::createTableShell(
  title = " Hypertension Experiment 2",
  targetCohorts = list(
    ClinicalCharacteristics::createCohortInfo(id = 1, name = "Hypertension")
  ),
  lineItems = ClinicalCharacteristics::lineItems(
    ClinicalCharacteristics::createCohortLineItemBatch(
      sectionLabel = "Drug Cohorts Any Presence",
      covariateCohorts = covariate_cohorts,
      cohortTable = executionSettings$cohortTable,
      timeIntervals = time_windows,
      statistic = ClinicalCharacteristics::anyPresenceStat()
    )
  )
)
result_era <- generateTableShell(ts_2, executionSettingsForClinChar, buildOptions = buildOptionsEra)
result_startDate <- generateTableShell(ts_2, executionSettingsForClinChar, buildOptions = buildOptionsStartDate)