Plots the age distributions using the binary age groups
Source:R/CharacterizationPlots.R
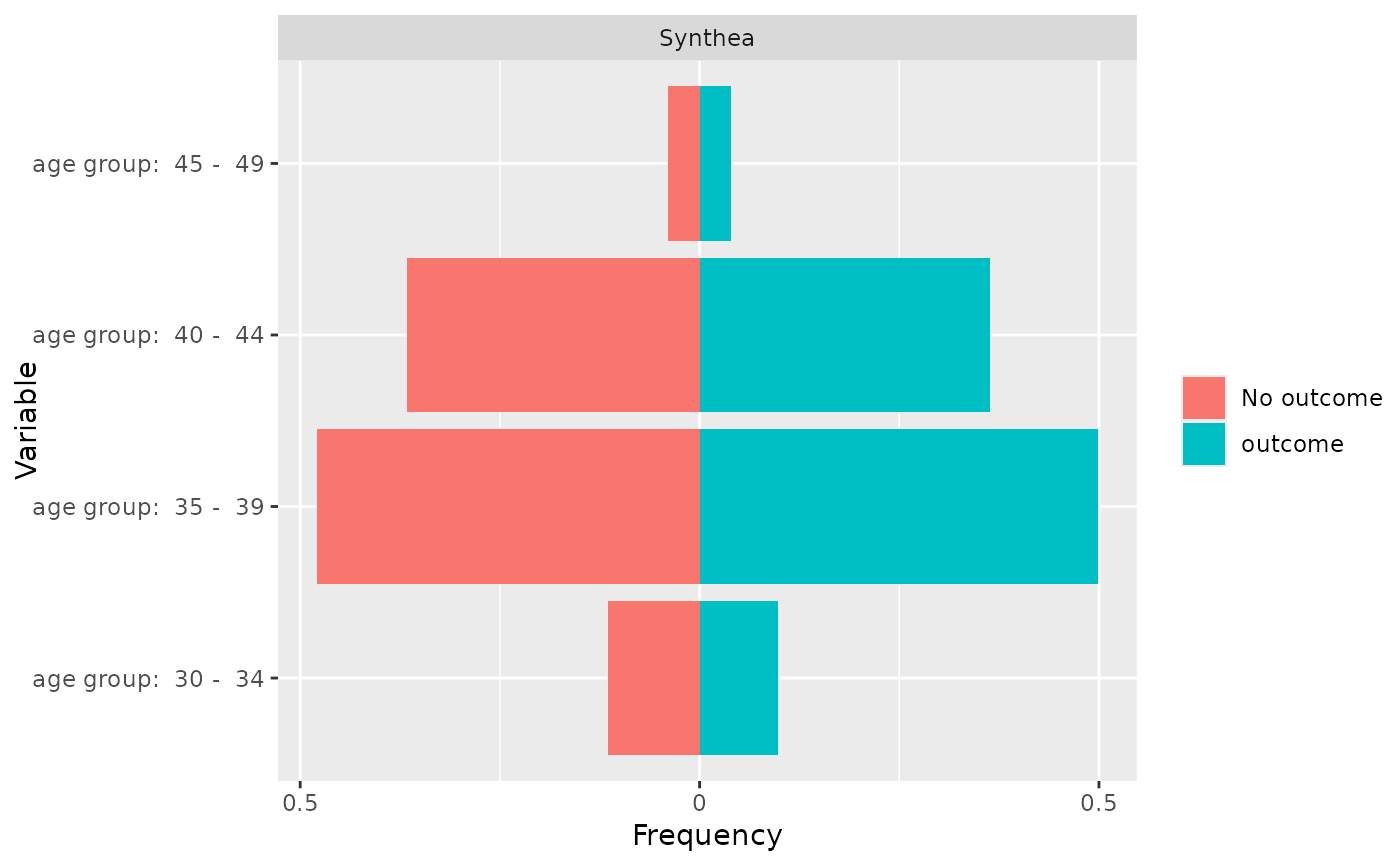
plotAgeDistributions.RdCreates bar charts for the target and case age groups.
Usage
plotAgeDistributions(
  ageData,
  riskWindowStart = "1",
  riskWindowEnd = "365",
  startAnchor = "cohort start",
  endAnchor = "cohort start"
)Details
Input the data returned from 'getCharacterizationDemographics(type = 'age')' and the time-at-risk
See also
Other Characterization:
getBinaryCaseSeries(),
getBinaryRiskFactors(),
getBinaryTargetBaseline(),
getCaseCounts(),
getCaseTargetCounts(),
getCharacterizationCohortBinary(),
getCharacterizationCohortContinuous(),
getCharacterizationDemographics(),
getCharacterizationOutcomes(),
getCharacterizationTargets(),
getContinuousCaseSeries(),
getContinuousRiskFactors(),
getDechallengeRechallenge(),
getDechallengeRechallengeFails(),
getIncidenceOutcomes(),
getIncidenceRates(),
getIncidenceTargets(),
getTargetBinaryFeatures(),
getTargetContinuousFeatures(),
getTimeToEvent(),
plotSexDistributions(),
viewIncidenceRate()
Examples
conDet <- getExampleConnectionDetails()

connectionHandler <- ResultModelManager::ConnectionHandler$new(conDet)
#> Connecting using SQLite driver

ageData <- getCharacterizationDemographics(
connectionHandler = connectionHandler,
schema = 'main',
targetId = 1,
outcomeId = 3,
type = 'age'
)

plotAgeDistributions(ageData = ageData)