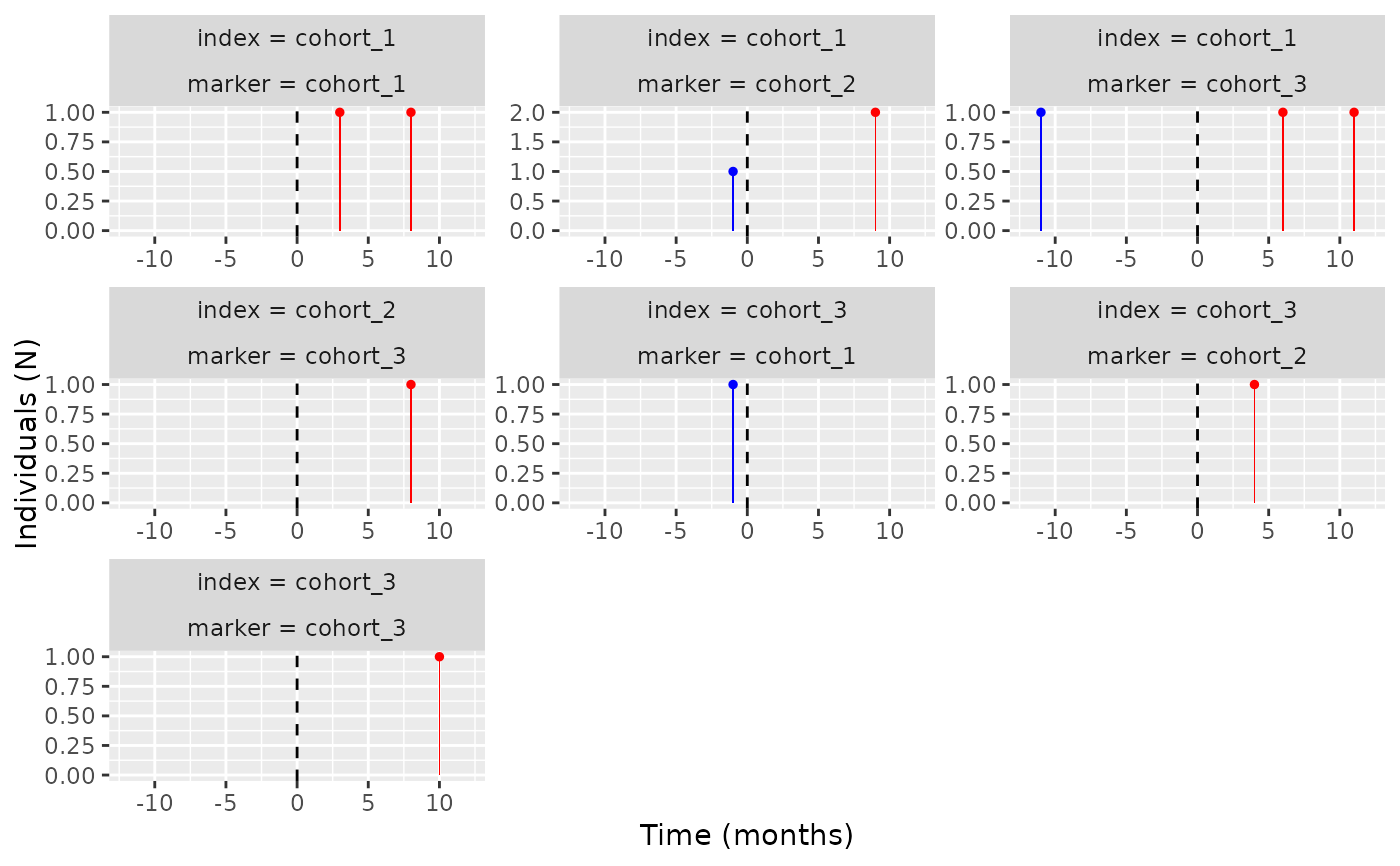
A plot for the temporal symmetry of cohorts.
Source:R/plotTemporalSymmetry.R
plotTemporalSymmetry.RdIt provides a ggplot of the temporal symmetry of two or more cohorts.
Arguments
- result
Table output from summariseTemporalSymmetry.
- plotTitle
Title of the plot, if NULL no title will be plotted.
- labs
Axis labels for the plot.
- xlim
Limits for the x axis of the plot.
- colours
Colours for both parts of the plot, pre- and post- time 0.
- scales
Whether to set free y scales for the facet wrap when there are multiple plots (i.e. each plot has its own scaled y axis) or set them equal for all. Only accepts "free" for the former and "fixed" for the latter.
Examples
# \donttest{
library(CohortSymmetry)
cdm <- mockCohortSymmetry()
#> Creating a new cdm
#> Uploading table person (5 rows) - [1/11]
#> Uploading table observation_period (5 rows) - [2/11]
#> Uploading table cdm_source (1 rows) - [3/11]
#> Uploading table concept (3361 rows) - [4/11]
#> Uploading table vocabulary (65 rows) - [5/11]
#> Uploading table concept_relationship (117257 rows) - [6/11]
#> Uploading table concept_synonym (3895 rows) - [7/11]
#> Uploading table concept_ancestor (1327 rows) - [8/11]
#> Uploading table drug_strength (45 rows) - [9/11]
#> Uploading table cohort_1 (10 rows) - [10/11]
#> Uploading table cohort_2 (11 rows) - [11/11]
cdm <- generateSequenceCohortSet(cdm = cdm,
                                 indexTable = "cohort_1",
                                 markerTable = "cohort_2",
                                 name = "joined_cohort")
#> Warning: restarting interrupted promise evaluation
temporal_symmetry <- summariseTemporalSymmetry(cohort = cdm$joined_cohort)
plotTemporalSymmetry(result = temporal_symmetry)

CDMConnector::cdmDisconnect(cdm = cdm)
# }
CDMConnector::cdmDisconnect(cdm = cdm)
# }