Create a ggplot2 plot from the output of summariseTrend()
Arguments
- result
A summarised_result object (output of
summariseTrend()).- output
The output to plot. Accepted values are:
"record","person","person-days","age","sex"If not specified, the function will default to:the only available output if there is just one in the results, or
"record"if multiple outputs are present.
- facet
Columns to face by. Formula format can be provided. See possible columns to face by with:
visOmopResults::tidyColumns().- colour
Columns to colour by. See possible columns to colour by with:
visOmopResults::tidyColumns().- style
Visual theme to apply. Character, or
NULL. If a character, this may be either the name of a built-in style (seevisOmopResults::plotStyle()), or a path to a .yml file that defines a custom style. IfNULL, the function will use the explicit default style, unless a global style option is set (seevisOmopResults::setGlobalPlotOptions()) or a _brand.yml file is present (in that order).- type
Character string indicating the output plot format. See
visOmopResults::plotType()for the list of supported plot types. Iftype = NULL, the function will use the global setting defined viavisOmopResults::setGlobalPlotOptions()(if available); otherwise, a standardggplot2plot is produced by default.
Examples
# \donttest{
library(dplyr)
library(OmopSketch)
library(omock)
cdm <- mockCdmFromDataset(datasetName = "GiBleed", source = "duckdb")
#> ℹ Loading bundled GiBleed tables from package data.
#> ℹ Adding drug_strength table.
#> ℹ Creating local <cdm_reference> object.
#> ℹ Inserting <cdm_reference> into duckdb.
result <- summariseTrend(cdm,
episode = "observation_period",
output = c("person-days", "record"),
interval = "years",
ageGroup = list("<=40" = c(0, 40), ">40" = c(41, Inf)),
sex = TRUE
)
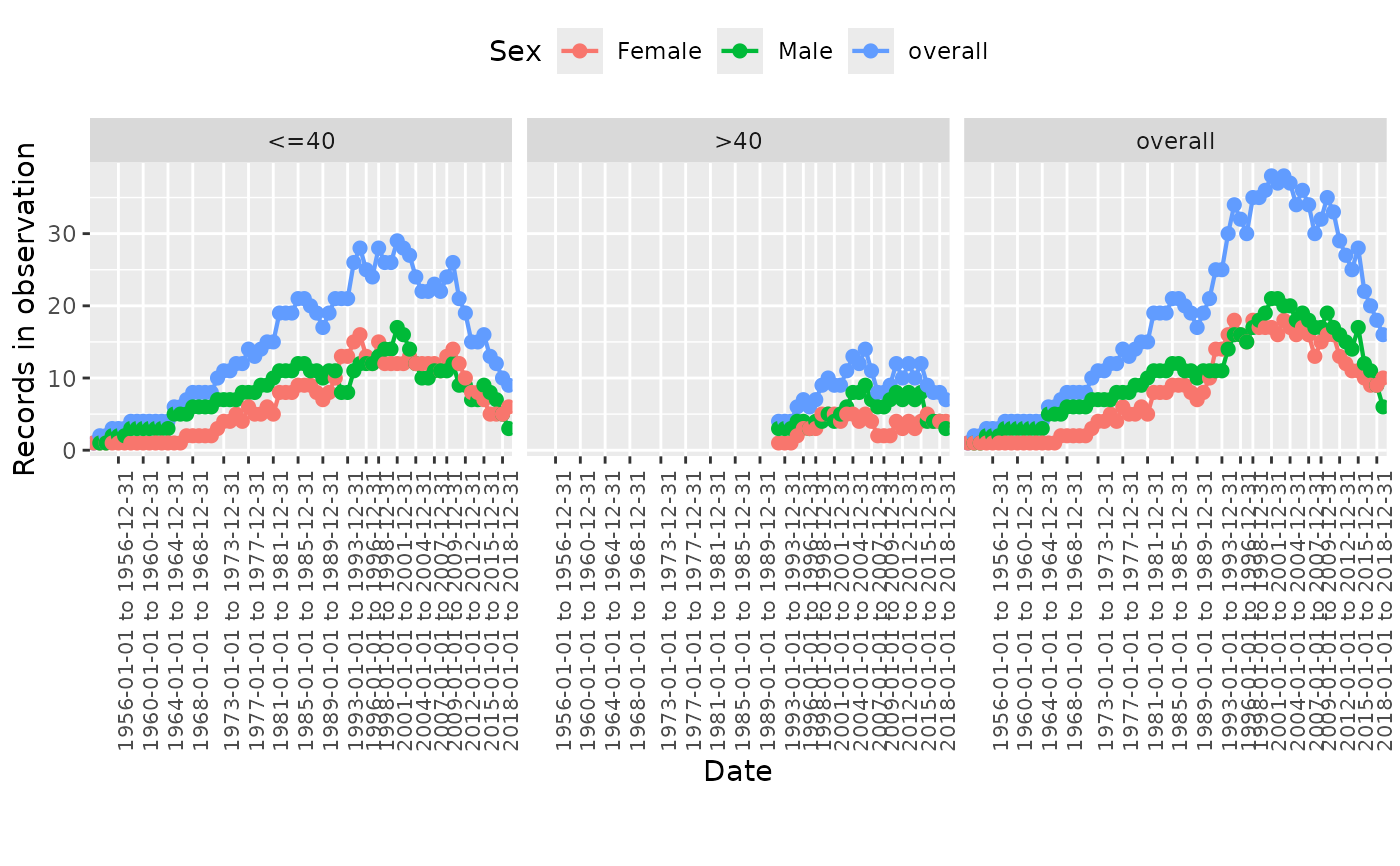
plotTrend(
result = result,
output = "record",
colour = "sex",
facet = "age_group"
)
 cdmDisconnect(cdm = cdm)
# }
cdmDisconnect(cdm = cdm)
# }