This function summarises temporal trends from OMOP CDM tables, considering only data within the observation period. It supports both event and episode tables and can report trends such as number of records, number of subjects, person-days, median age, and number of females.
Usage
summariseTrend(
  cdm,
  event = NULL,
  episode = NULL,
  output = "record",
  interval = "overall",
  ageGroup = NULL,
  sex = FALSE,
  inObservation = FALSE,
  dateRange = NULL
)
Arguments
- cdm
A
cdm_referenceobject. Use CDMConnector to create a reference to a database or omock to create a reference to synthetic data.- event
A character vector of OMOP table names to treat as event tables (uses only start date).
- episode
A character vector of OMOP table names to treat as episode tables (uses start and end date).
- output
A character vector indicating what to summarise. Options include
"record"(default),"person","person-days","age","sex". If included, the number of person-days and end dates are computed only for episode tables.- interval
Time interval to stratify by. It can either be "years", "quarters", "months" or "overall".
- ageGroup
A list of age groups to stratify the results by. Each element represents a specific age range. You can give them specific names, e.g.
ageGroup = list(children = c(0, 17), adult = c(18, Inf)).- sex
Logical; whether to stratify results by sex (
TRUE) or not (FALSE).- inObservation
Logical. If
TRUE, the results are stratified to indicate whether each record occurs within an observation period.- dateRange
A vector of two dates defining the desired study period. If
dateRangeisNULL, no restriction is applied.
Details
Event tables: Records are included if their start date falls within the study period. Each record contributes to the time interval containing the start date.
Episode tables: Records are included if their start or end date overlaps with the study period. Records are trimmed to the date range, and contribute to all overlapping time intervals between start and end dates.
Examples
# \donttest{
library(OmopSketch)
library(omock)
library(dplyr)
cdm <- mockCdmFromDataset(datasetName = "GiBleed", source = "duckdb")
#> ℹ Loading bundled GiBleed tables from package data.
#> ℹ Adding drug_strength table.
#> ℹ Creating local <cdm_reference> object.
#> ℹ Inserting <cdm_reference> into duckdb.
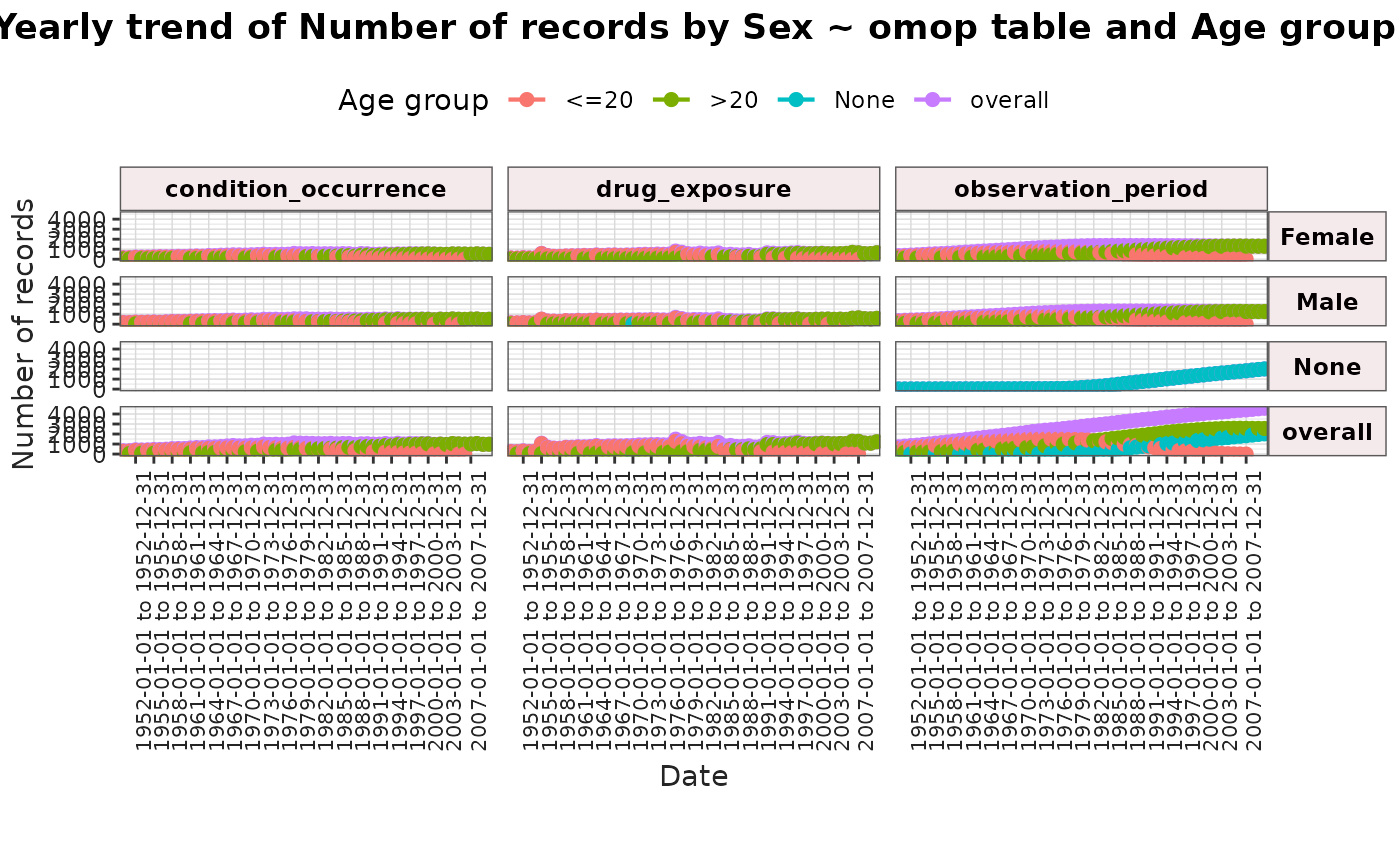
result <- summariseTrend(
cdm = cdm,
event = c("condition_occurrence", "drug_exposure"),
episode = "observation_period",
output = "person",
interval = "years",
ageGroup = list("<=20" = c(0, 20), ">20" = c(21, Inf)),
sex = TRUE,
dateRange = as.Date(c("1950-01-01", "2010-12-31"))
)
plotTrend(result = result, facet = sex ~ omop_table, colour = c("age_group"))
#> Warning: `type` not included in facet or colour, but have multiple values.
 cdmDisconnect(cdm = cdm)
# }
cdmDisconnect(cdm = cdm)
# }