Chapter 8 OHDSI Analytics Tools
Chapter leads: Martijn Schuemie & Frank DeFalco
OHDSI offers a wide range of open source tools to support various data-analytics use cases on observational patient-level data. What these tools have in common is that they can all interact with one or more databases using the Common Data Model (CDM). Furthermore, these tools standardize the analytics for various use cases; Rather than having to start from scratch, an analysis can be implemented by filling in standard templates. This makes performing analysis easier, and also improves reproducibility and transparency. For example, there appear to be a near-infinite number of ways to compute an incidence rate, but these can be specified in the OHDSI tools with a few choices, and anyone making those same choices will compute incidence rates the same way.
In this chapter we first describe various ways in which we can choose to implement an analysis, and what strategies the analysis can employ. We then review the various OHDSI tools and how they fit the various use cases.
8.1 Analysis Implementation
Figure 8.1 shows the various ways in which we can choose to implement a study against a database using the CDM.
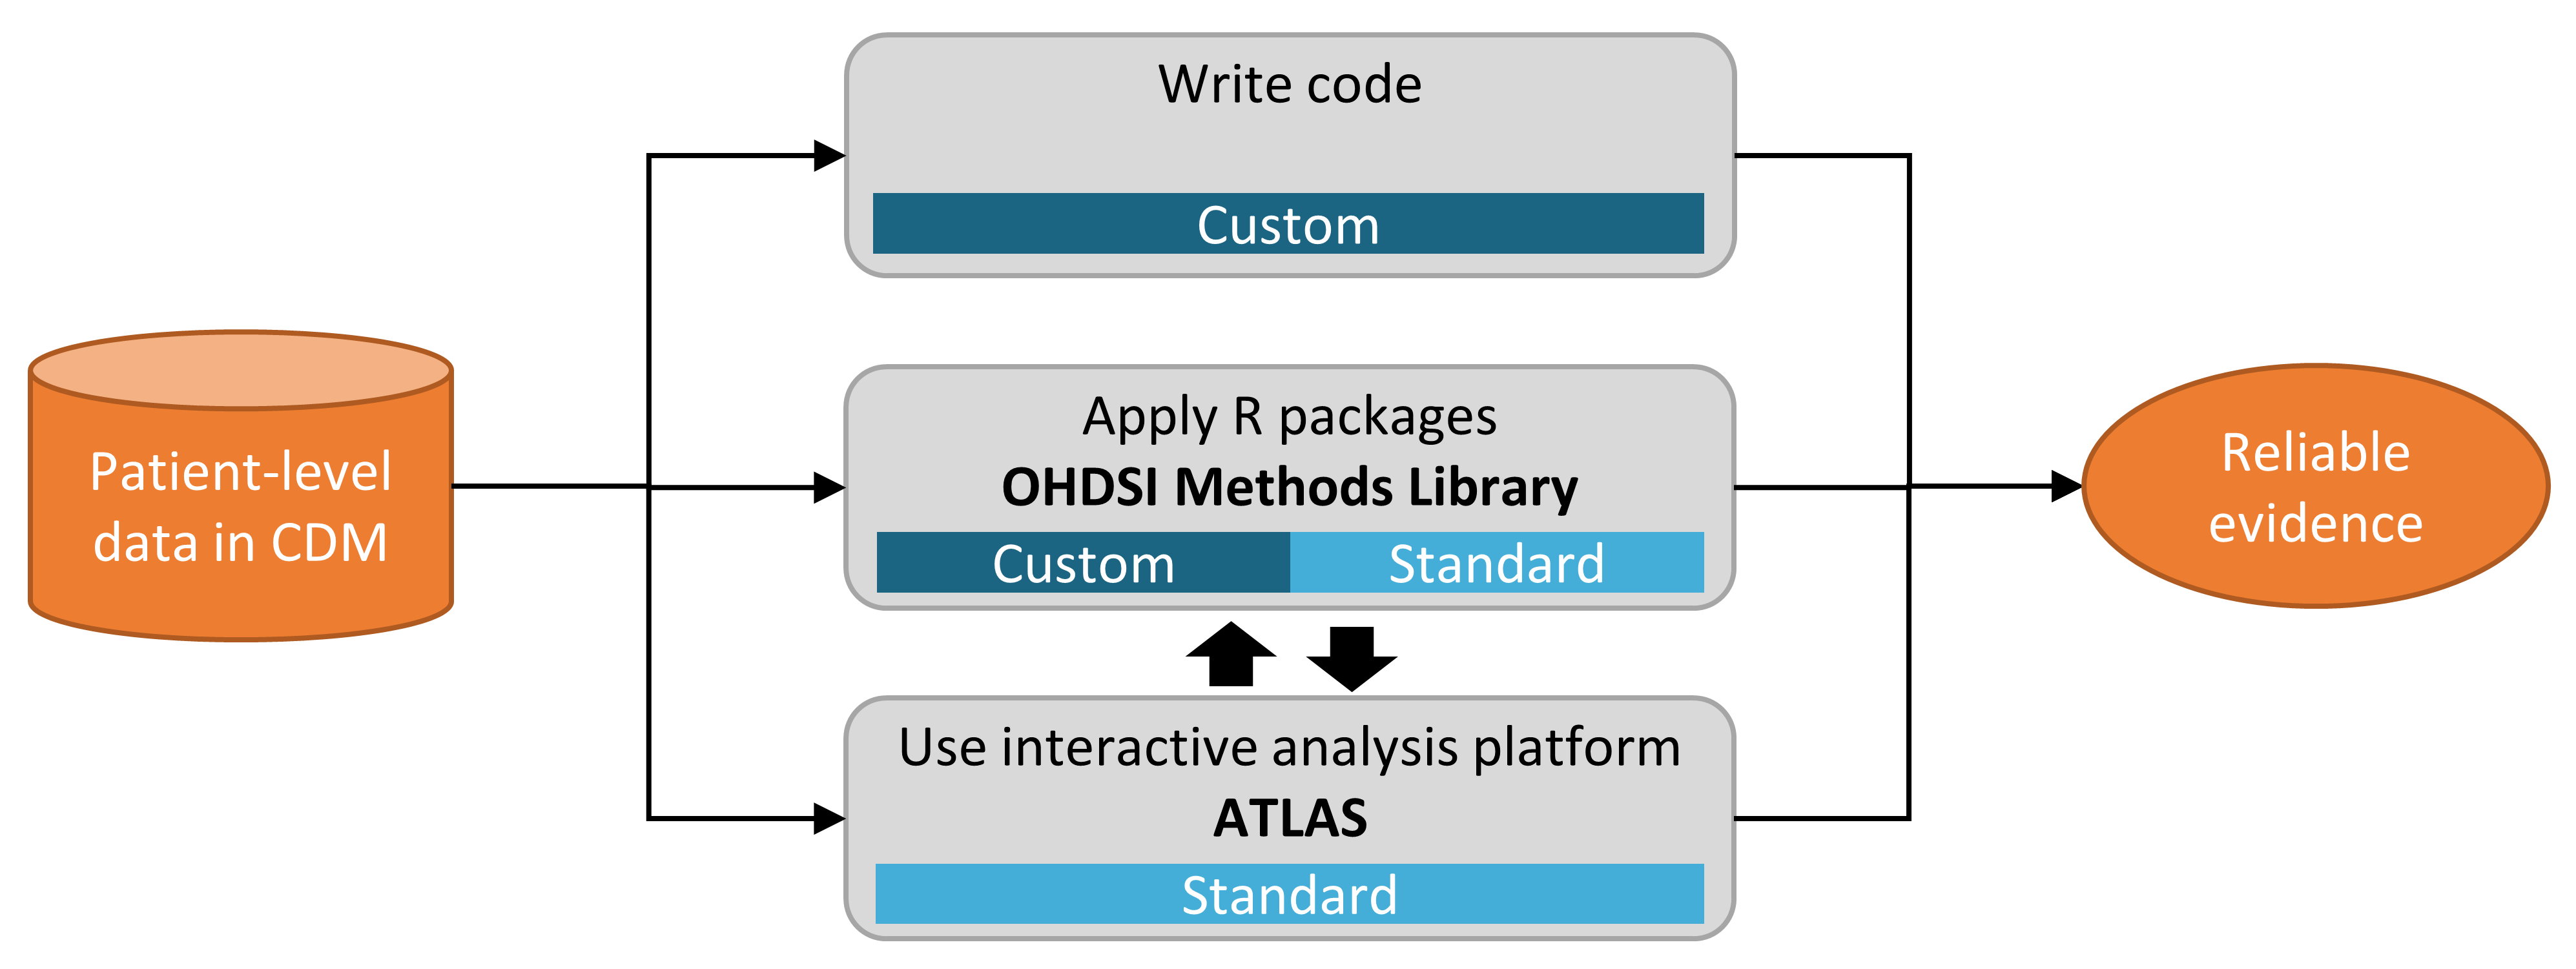
Figure 8.1: Different ways to implement an analysis against data in the CDM.
There are three main approaches to implementing a study. The first is to write custom code that does not make use of any of the tools OHDSI has to offer. One could write a de novo analysis in R, SAS, or any other language. This provides the maximum flexibility, and may in fact be the only option if the specific analysis is not supported by any of our tools. However, this path requires a lot of technical skill, time, and effort, and as the analysis increases in complexity it becomes harder to avoid errors in the code.
The second approach involves developing the analysis in R, and making use of the packages in the OHDSI Methods Library. At a minimum, one could use the SqlRender and DatabaseConnector packages described in more detail in Chapter 9 that allow the same code to be executed on various database platforms, such as PostgreSQL, SQL Server, and Oracle. Other packages such as CohortMethod and PatientLevelPrediction offer R functions for advanced analytics against the CDM that can be called on in one’s code. This still requires a lot of technical expertise, but by re-using the validated components of the Methods Library we can be more efficient and less prone to error than when using completely custom code.
The third approach relies on our interactive analysis platform ATLAS, a web-based tool that allows non-programmers to perform a wide range of analyses efficiently. ATLAS makes use of the Methods Libraries but provides a simple graphical interface to design analyses and in many cases generate the necessary R code to run the analysis. However, ATLAS does not support all options available in the Methods Library. While it is expected that the majority of studies can be performed through ATLAS, some studies may require the flexibility offered by the second approach.
ATLAS and the Methods Library are not independent. Some of the more complicated analytics that can be invoked in ATLAS are executed through calls to the packages in the Methods Library. Similarly, cohorts used in the Methods Library are often designed in ATLAS.
8.2 Analysis Strategies
In addition to the strategy used to implement our analysis against the CDM, for example through custom coding or use of standard analytic code in the Methods Library, there are also multiple strategies for using those analytic techniques to generate evidence. Figure 8.2 highlights three strategies that are employed in OHDSI.
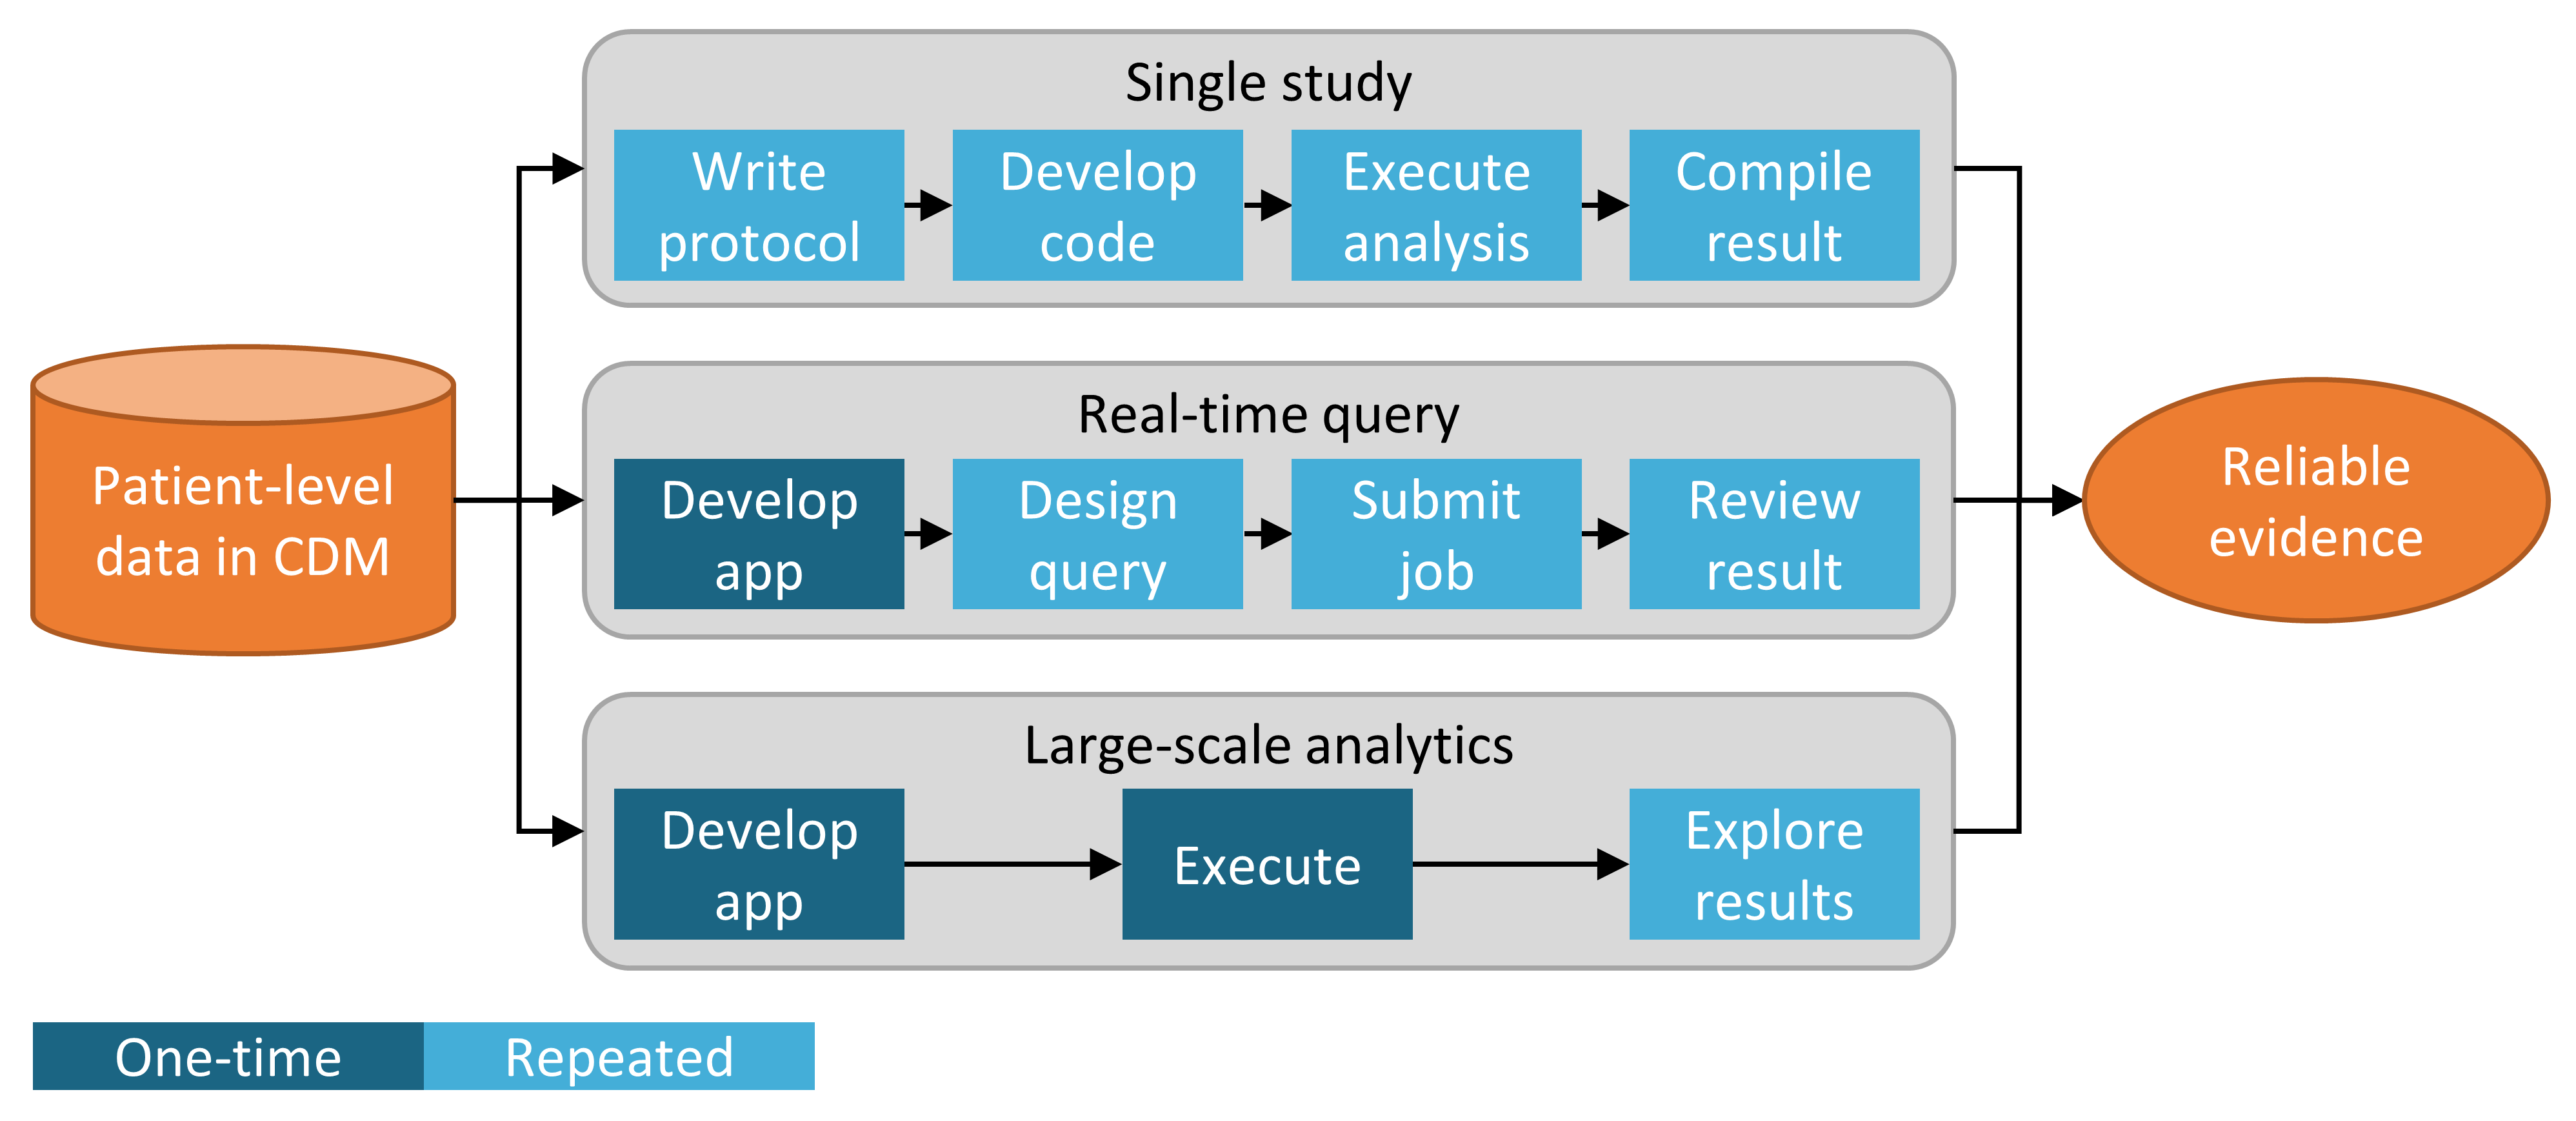
Figure 8.2: Strategies for generating evidence for (clinical) questions.
The first strategy views every analysis as a single individual study. The analysis must be pre-specified in a protocol, implemented as code, executed against the data, after which the result can be compiled and interpreted. For every question, all steps must be repeated. An example of such an analysis is the OHDSI study into the risk of angioedema associated with levetiracetam compared with phenytoin. (Duke et al. 2017) Here, a protocol was first written, analysis code using the OHDSI Methods Library was developed and executed across the OHDSI network, and results were compiled and disseminated in a journal publication.
The second strategy develops an application that allows users to answer a specific class of questions in real time or near-real time. Once the application has been developed, users can interactively define queries, submit them, and view the results. An example of this strategy is the cohort definition and generation tool in ATLAS. This tool allows users to specify cohort definitions of varying complexity, and execute the definition against a database to see how many people meet the various inclusion and exclusion criteria.
The third strategy similarly focuses on a class of questions, but then attempts to exhaustively generate all the evidence for the questions within the class. Users can then explore the evidence as needed through a variety of interfaces. One example is the OHDSI study into the effects of depression treatments. (Schuemie, Ryan, et al. 2018) In this study all depression treatments are compared for a large set of outcomes of interest across four large observational databases. The full set of results, including 17,718 empirically calibrated hazard ratios along with extensive study diagnostics, is available in an interactive web app.39
8.3 ATLAS
ATLAS is a free, publicly available, web-based tool developed by the OHDSI community that facilitates the design and execution of analyses on standardized, patient-level, observational data in the CDM format. ATLAS is deployed as a web application in combination with the OHDSI WebAPI and is typically hosted on Apache Tomcat. Performing real time analyses requires access to the patient-level data in the CDM and is therefore typically installed behind an organization’s firewall. However, there is also a public ATLAS40, and although this ATLAS instance only has access to a few small simulated datasets, it can still be used for many purposes including testing and training. It is even possible to fully define an effect estimation or prediction study using the public instance of ATLAS, and automatically generate the R code for executing the study. That code can then be run in any environment with an available CDM without needing to install ATLAS and the WebAPI.
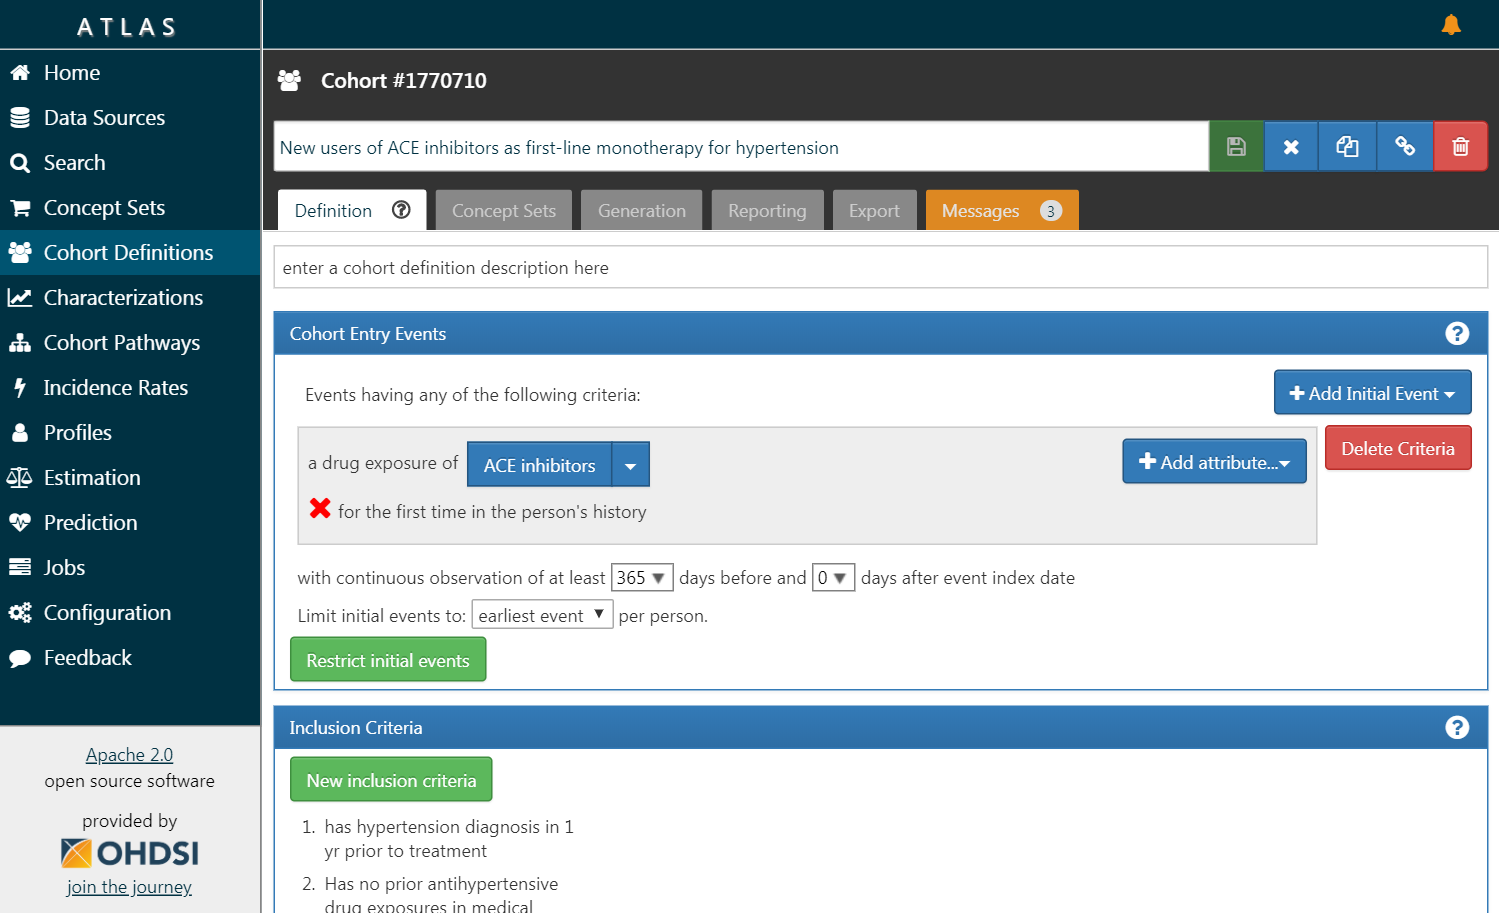
Figure 8.3: ATLAS user interface.
A screenshot of ATLAS is provided in Figure 8.3. On the left is a navigation bar showing the various functions provided by ATLAS:
- Data Sources
- Data sources provides the capability review descriptive, standardized reporting for each of the data sources that you have configured within your Atlas platform. This feature uses the large-scale analytics strategy: all descriptives have been pre-computed. Data sources is discussed in Chapter 11.
- Vocabulary Search
- Atlas provides the ability to search and explore the OMOP standardized vocabulary to understand what concepts exist within those vocabularies and how to apply those concepts in your standardized analysis against your data sources. This feature is discussed in Chapter 5.
- Concept Sets
- Concept sets provides the ability to create collections of logical expressions that can be used to identify a set of concepts to be used throughout your standardized analyses. Concept sets provide more sophistication than a simple list of codes or values. A concept set is comprised of multiple concepts from the standardized vocabulary in combination with logical indicators that allow a user to specify that they are interested in including or excluding related concepts in the vocabulary hierarchy. Searching the vocabulary, identifying the set of concepts, and specifying the logic to be used to resolve a concept set provides a powerful mechanism for defining the often obscure medical language used in analysis plans. These concept sets can be saved within ATLAS and then used throughout your analysis as part of cohort definitions or analysis specifications.
- Cohort Definitions
- Cohort definitions is the ability to construct a set of persons who satisfy one or more criteria for a duration of time and these cohorts can then serve as the basis of inputs for all of your subsequent analyses. This feature is discussed in Chapter 10.
- Characterizations
- Characterizations is an analytic capability that allows you to look at one or more cohorts that you’ve defined and to summarize characteristics about those patient populations. This feature uses the real-time query strategy, and is discussed in Chapter 11.
- Cohort Pathways
- Cohort pathways is an analytic tool that allows you to look at the sequence of clinical events that occur within one or more populations. This feature uses the real-time query strategy, and is discussed in Chapter 11.
- Incidence Rates
- Incidence rates is a tool that allows you to estimate the incidence of outcomes within target populations of interest. This feature uses the real-time query strategy, and is discussed in Chapter 11.
- Profiles
- Profiles is a tool that allows you to explore an individual patients longitudinal observational data to summarize what is going on within a given individual. This feature uses the real-time query strategy.
- Population Level Estimation
- Estimation is a capability to allow you to define a population level effect estimation study using a comparative cohort design whereby comparisons between one or more target and comparator cohorts can be explored for a series of outcomes. This feature can be said to implement the real-time query strategy, as no coding is required, and is discussed in Chapter 12.
- Patient Level Prediction
- Prediction is a capability to allow you to apply machine learning algorithms to conduct patient level prediction analyses whereby you can predict an outcome within any given target exposures. This feature can be said to implement the real-time query strategy, as no coding is required, and is discussed in Chapter 13.
- Jobs
- Select the Jobs menu item to explore the state of processes that are running through the WebAPI. Jobs are often long running processes such as generating a cohort or computing cohort characterization reports.
- Configuration
- Select the Configuration menu item to review the data sources that have been configured in the source configuration section.
- Feedback
- The Feedback link will take you to the issue log for Atlas so that you can log a new issue or to search through existing issues. If you have ideas for new features or enhancements, this is also a place note these for the development community.
8.3.1 Security
ATLAS and the WebAPI provide a granular security model to control access to features or data sources within the overall platform. The security system is built leveraging the Apache Shiro library. Additional information on the security system can be found in the online WebAPI security wiki.41
8.3.2 Documentation
Documentation for ATLAS can be found online in the ATLAS GitHub repository wiki.42 This wiki includes information on the various application features as well as links to online video tutorials.
8.4 Methods Library
The OHDSI Methods Library is the collection of open source R packages show in Figure 8.4.
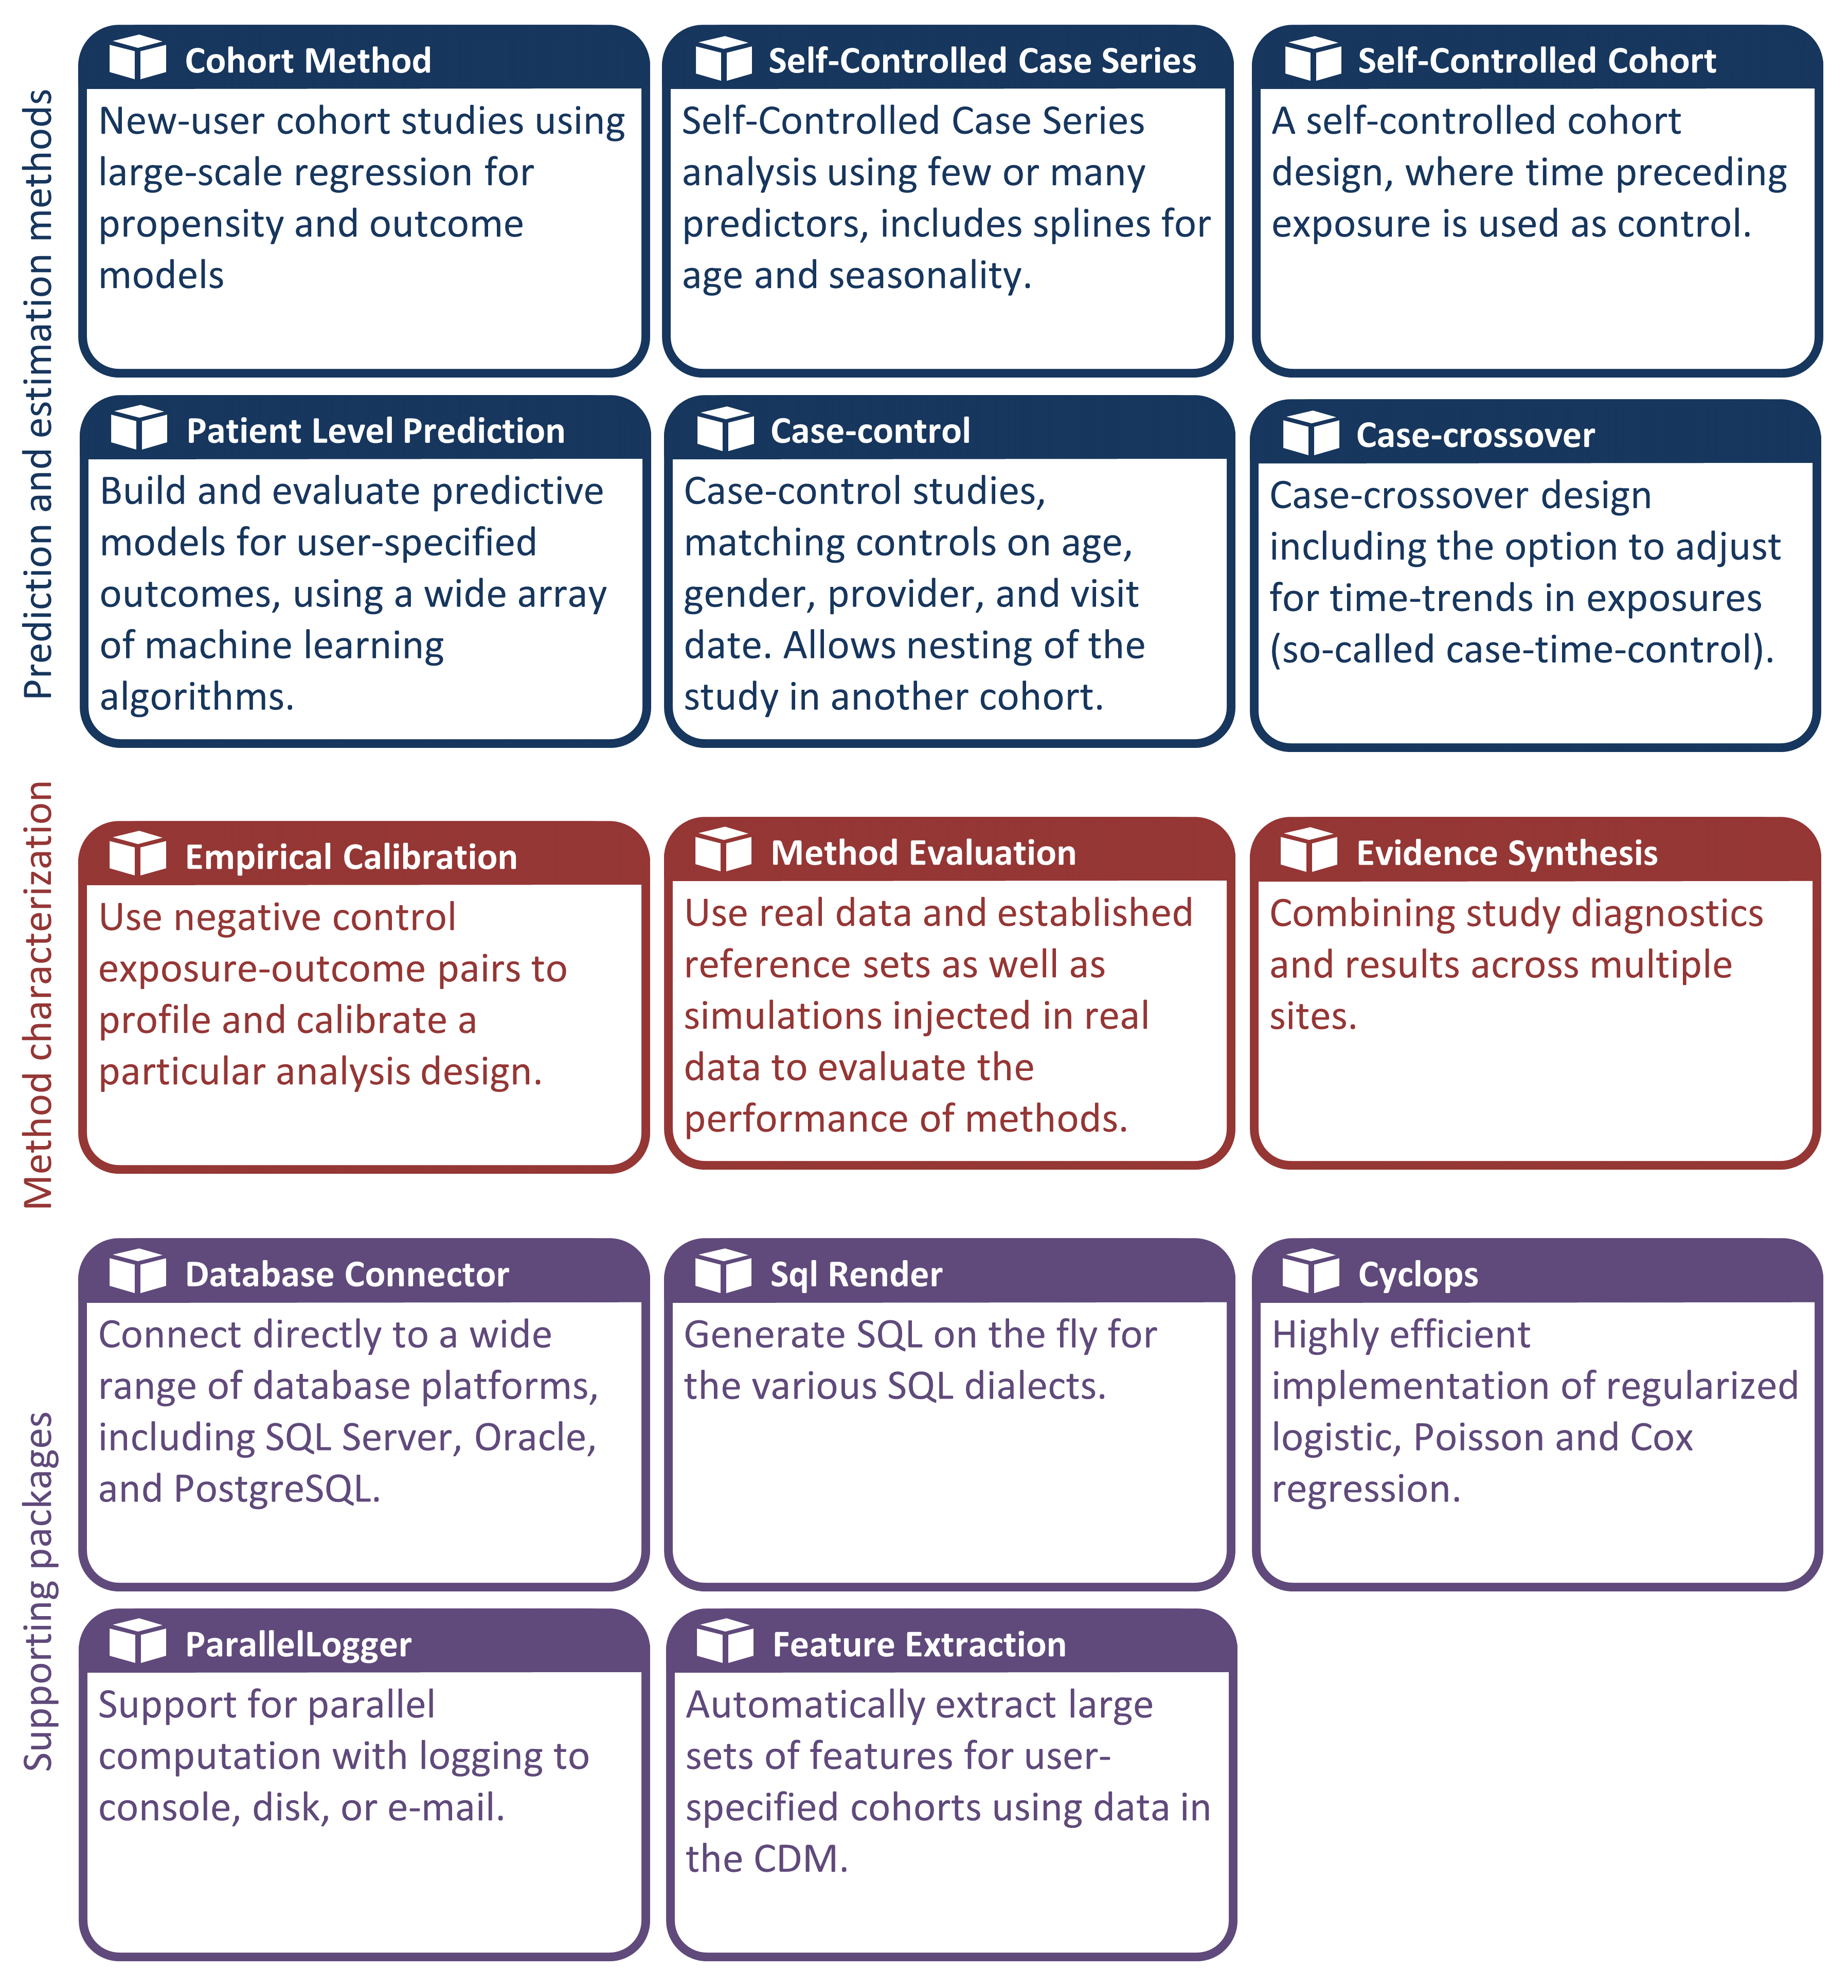
Figure 8.4: Packages in the OHDSI Methods Library.
The packages offer R functions that together can be used to perform a complete observational study, starting from data in the CDM, and resulting in estimates and supporting statistics, figures, and tables. The packages interact directly with observational data in the CDM, and can be used simply to provide cross-platform compatibility to completely custom analyses as described in Chapter 9, or can provide advanced standardized analytics for population characterization (Chapter 11), population-level effect estimation (Chapter 12), and patient-level prediction (Chapter 13). The Methods Library supports best practices for use of observational data and observational study design as learned from previous and ongoing research, such as transparency, reproducibility, as well as measuring of the operating characteristics of methods in a particular context and subsequent empirical calibration of estimates produced by the methods.
The Methods Library has already been used in many published clinical studies (Boland et al. 2017; Duke et al. 2017; Ramcharran et al. 2017; Weinstein et al. 2017; Wang et al. 2017; Ryan et al. 2017, 2018; Vashisht et al. 2018; Yuan et al. 2018; Johnston et al. 2019), as well as methodological studies. (Schuemie et al. 2014, 2016; Reps et al. 2018; Tian, Schuemie, and Suchard 2018; Schuemie, Hripcsak, et al. 2018; Schuemie, Ryan, et al. 2018; Reps, Rijnbeek, and Ryan 2019) The validity of the implementations of methods in the Methods library is described in Chapter 17.
8.4.1 Support for Large-Scale Analytics
One key feature incorporated in all packages is the ability to efficiently run many analyses. For example, when performing population-level estimation, the CohortMethod package allows for computing effect-size estimates for many exposures and outcomes, using various analysis settings, and the package will automatically choose the optimal way to compute all the required intermediary and final data sets. Steps that can be re-used, such as extraction of covariates, or fitting a propensity model that is used for one target-comparator pair but multiple outcomes, will be executed only once. Where possible, computations will take place in parallel to maximize the use of computational resources.
This computational efficiency allows for large-scale analytics, answering many questions at once, and is also essential for including control hypotheses (e.g. negative controls) to measure the operating characteristics of our methods, and perform empirical calibration as described in Chapter 18.
8.4.2 Support for Big Data
The Methods Library is also designed to run against very large databases and be able to perform computations involving large amounts of data. This achieved in three ways:
- Most data manipulation is performed on the database server. An analysis usually only requires a small fraction of the entire data in the database, and the Methods Library, through the SqlRender and DatabaseConnector packages, allows for advanced operations to be performed on the server to preprocess and extract the relevant data.
- Large local data objects are stored in a memory-efficient manner. For the data that is downloaded to the local machine, the Methods Library uses the ff package to store and work with large data objects. This allows us to work with data much larger than fits in memory.
- High-performance computing is applied where needed. For example, the Cyclops package implements a highly efficient regression engine that is used throughout the Methods Library to perform large-scale regressions (large number of variables, large number of observations) that would not be possible to fit otherwise.
8.4.3 Documentation
R provides a standard way to document packages. Each package has a package manual that documents every function and data set contained in the package. All package manuals are available online through the Methods Library website45, through the package GitHub repositories, and for those packages available through CRAN they can be found in CRAN. Furthermore, from within R the package manual can be consulted by using the question mark. For example, after loading the DatabaseConnector package, typing the command ?connect brings up the documentation on the “connect” function.
In addition to the package manual, many packages provide vignettes. Vignettes are long-form documentation that describe how a package can be used to perform certain tasks. For example, one vignette46 describes how to perform multiple analyses efficiently using the CohortMethod package. Vignettes can also be found through the Methods Library website, through the package GitHub repositories, and for those packages available through CRAN they can be found in CRAN.
8.4.4 System Requirements
Two computing environments are relevant when discussing the system requirements: The database server, and the analytics workstation.
The database server must hold the observational healthcare data in CDM format. The Methods Library supports a wide array of database management systems including traditional database systems (PostgreSQL, Microsoft SQL Server, and Oracle), parallel data warehouses (Microsoft APS, IBM Netezza, and Amazon Redshift), as well as Big Data platforms (Hadoop through Impala, and Google BigQuery).
The analytics workstation is where the Methods Library is installed and run. This can either be a local machine, such as someone’s laptop, or a remote server running RStudio Server. In all cases the requirements are that R is installed, preferably together with RStudio. The Methods Library also requires that Java is installed. The analytics workstation should also be able to connect to the database server, specifically, any firewall between them should have the database server access ports opened the workstation. Some of the analytics can be computationally intensive, so having multiple processing cores and ample memory can help speed up the analyses. We recommend having at least four cores and 16 gigabytes of memory.
8.4.5 How to Install
Here are the steps for installing the required environment to run the OHDSI R packages. Four things need to be installed:
- R is a statistical computing environment. It comes with a basic user interface that is primarily a command-line interface.
- Rtools is a set of programs that is required on Windows to build R packages from source.
- RStudio is an IDE (Integrated Development Environment) that makes R easier to use. It includes a code editor, debugging and visualization tools. Please use it to obtain a nice R experience.
- Java is a computing environment that is needed to run some of the components in the OHDSI R packages, for example those needed to connect to a database.
Below we describe how to install each of these in a Windows environment.
Installing R
- Go to https://cran.r-project.org/, click on “Download R for Windows”, then “base”, then click the Download link indicated in Figure 8.5.
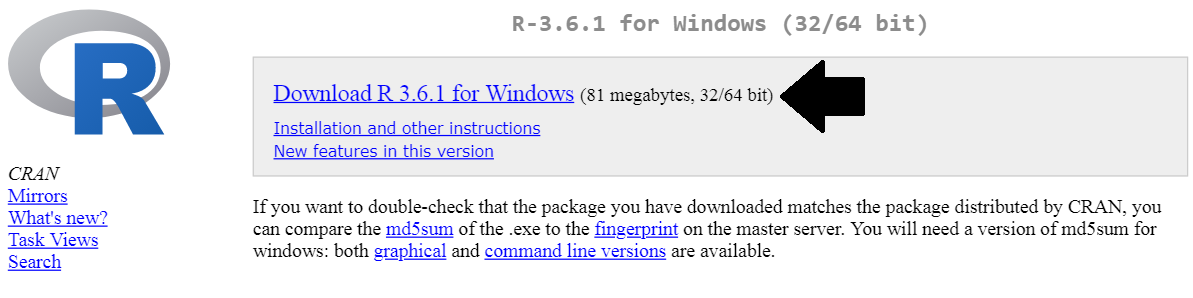
Figure 8.5: Downloading R from CRAN.
- After the download has completed, run the installer. Use the default options everywhere, with two exceptions: First, it is better not to install into program files. Instead, just make R a subfolder of your C drive as shown in Figure 8.6. Second, to avoid problems due to differing architectures between R and Java, disable the 32-bit architecture as shown in Figure 8.7.
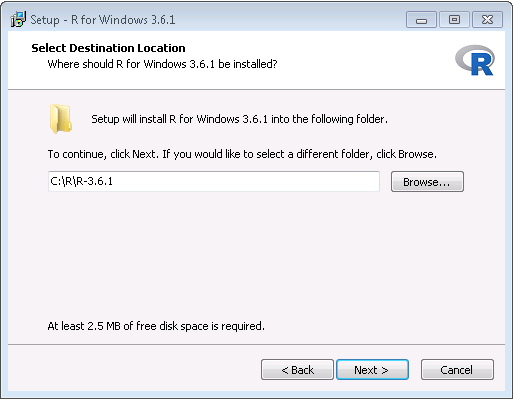
Figure 8.6: Settings the destination folder for R.
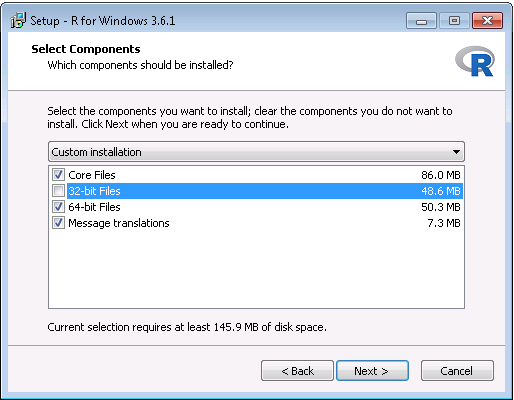
Figure 8.7: Disabling the 32-bit version of R.
Once completed, you should be able to select R from your Start Menu.
Installing Rtools
Go to https://cran.r-project.org/, click on “Download R for Windows”, then “Rtools”, and select the very latest version of Rtools to download.
After downloading has completed run the installer. Select the default options everywhere.
Installing RStudio
- Go to https://www.rstudio.com/, select “Download RStudio” (or the “Download” button under “RStudio”), opt for the free version, and download the installer for Windows as shown in Figure 8.8.
Figure 8.8: Downloading RStudio.
- After downloading, start the installer, and use the default options everywhere.
Installing Java
- Go to https://java.com/en/download/manual.jsp, and select the Windows 64-bit installer as shown in Figure 8.9. If you also installed the 32-bit version of R, you must also install the other (32-bit) version of Java.
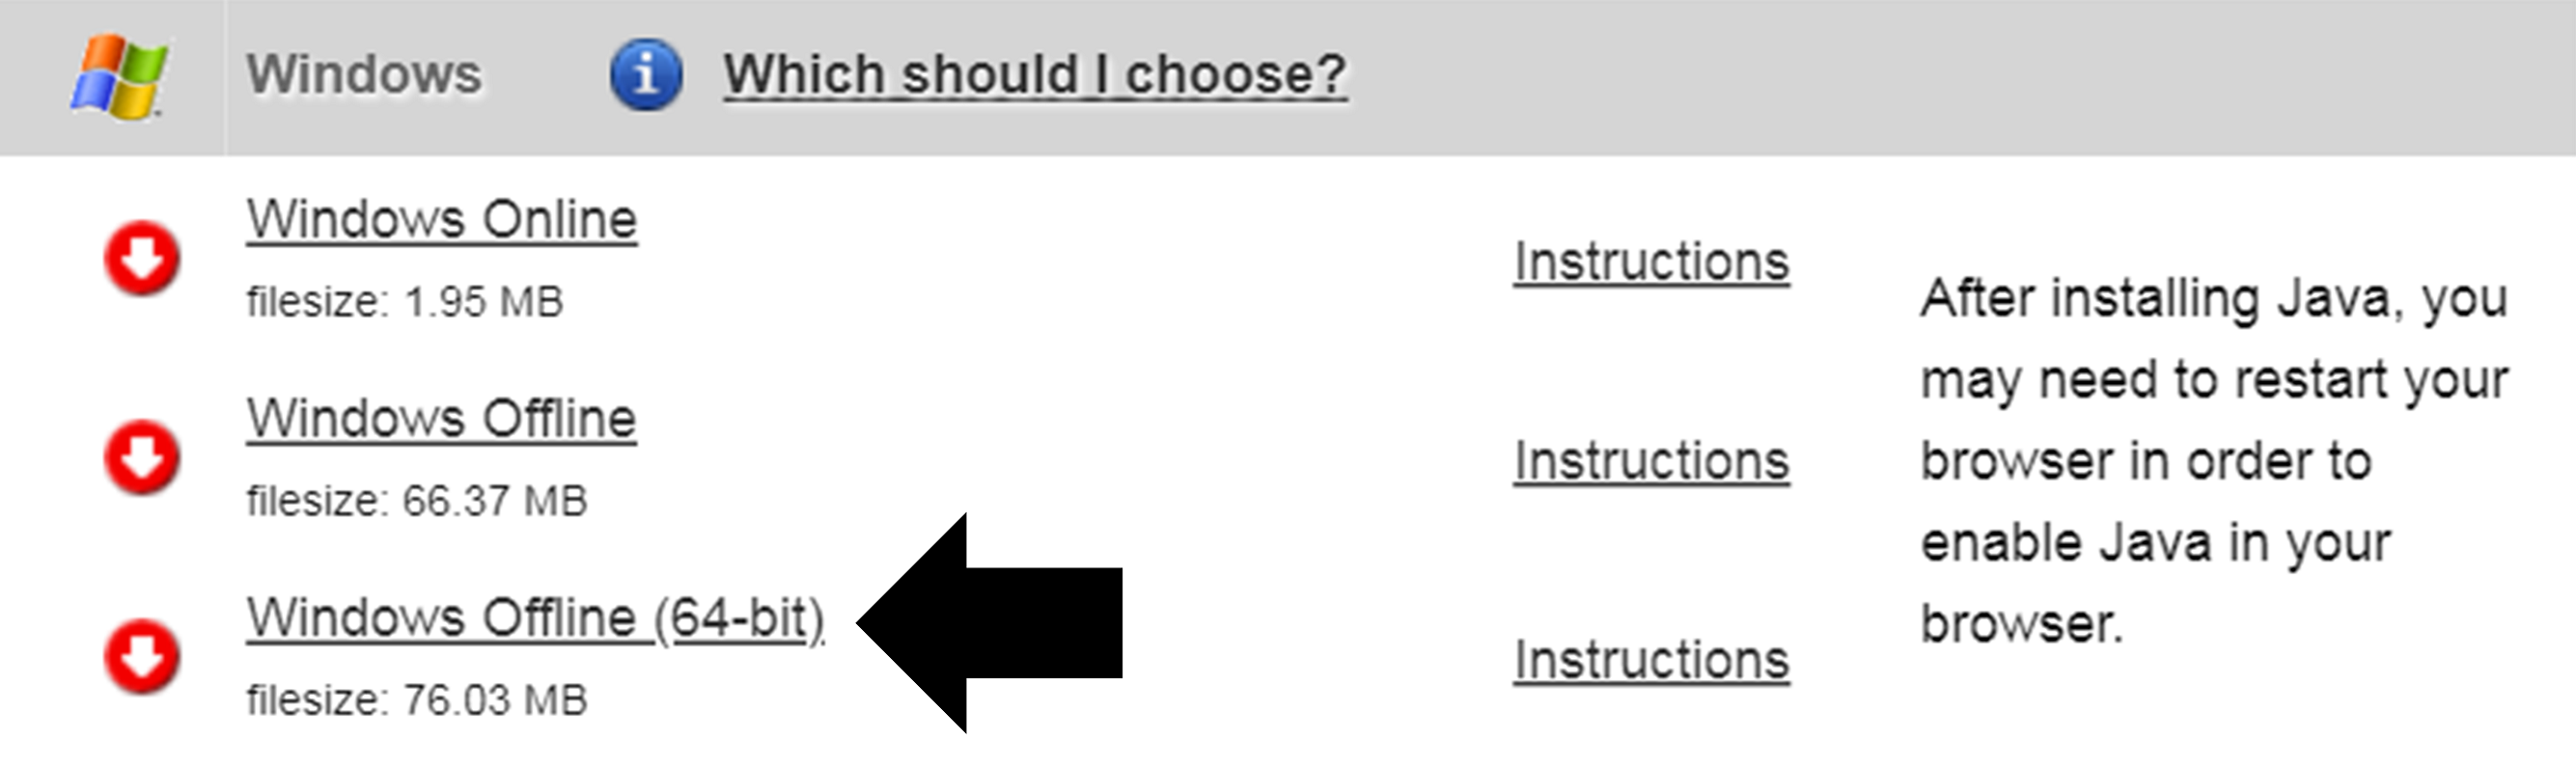
Figure 8.9: Downloading Java.
- After downloading just run the installer.
Verifying the Installation
You should now be ready to go, but we should make sure. Start RStudio, and type
install.packages("SqlRender")
library(SqlRender)
translate("SELECT TOP 10 * FROM person;", "postgresql")
## [1] "SELECT * FROM person LIMIT 10;"This function uses Java, so if all goes well we know both R and Java have been installed correctly!
Another test is to see if source packages can be built. Run the following R code to install the CohortMethod package from the OHDSI GitHub repository:
8.5 Deployment Strategies
Deploying the entire OHDSI tool stack, including ATLAS and the Methods Library, in an organization is a daunting task. There are many components with dependencies that have to be considered, and configurations to set. For this reason, two initiatives have developed integrated deployment strategies that allow the entire stack to be installed as one package, using some forms of virtualization: Broadsea and Amazon Web Services (AWS).
8.5.1 Broadsea
Broadsea47 uses Docker container technology.48 The OHDSI tools are packaged along with dependencies into a single portable binary file called a Docker Image. This image can then be run on a Docker engine service, creating a virtual machine with all the software installed and ready to run. Docker engines are available for most operating systems, including Microsoft Windows, MacOS, and Linux. The Broadsea Docker image contains the main OHDSI tools, including the Methods Library and ATLAS.
8.5.2 Amazon AWS
Amazon has prepared two environments that can be instantiated in the AWS cloud computing environment with a click of the button: OHDSI-in-a-Box49 and OHDSIonAWS.50
OHDSI-in-a-Box is specifically created as a learning environment, and is used in most of the tutorials provided by the OHDSI community. It includes many OHDSI tools, sample data sets, RStudio and other supporting software in a single, low cost Windows virtual machine. A PostgreSQL database is used to store the CDM and also to store the intermediary results from ATLAS. The OMOP CDM data mapping and ETL tools are also included in OHDSI-in-a-Box. The architecture for OHDSI-in-a-Box is depicted in Figure 8.10.
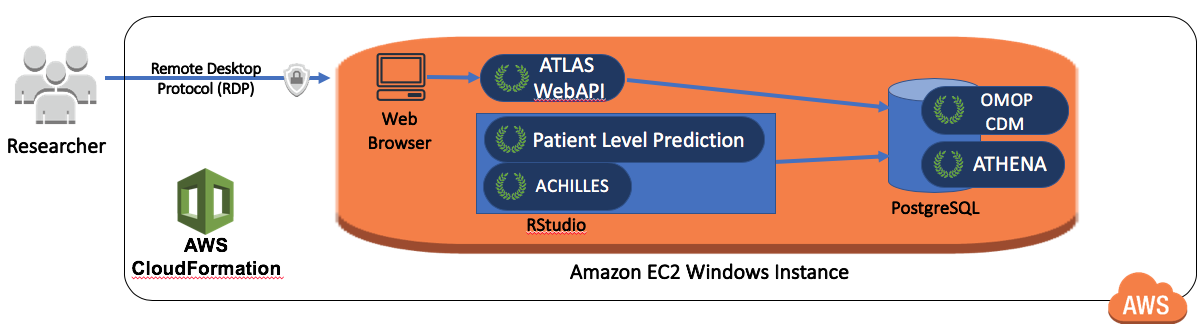
Figure 8.10: The Amazon Web Services architecture for OHDSI-in-a-Box.
OHDSIonAWS is a reference architecture for enterprise class, multi-user, scalable and fault tolerant OHDSI environments that can be used by organizations to perform their data analytics. It includes several sample datasets and can also automatically load your organization’s real healthcare data. The data is placed in the Amazon Redshift database platform, which is supported by the OHDSI tools. Intermediary results of ATLAS are stored in a PostgreSQL database. On the front end, users have access to ATLAS and to RStudio through a web interface (leveraging RStudio Server). In RStudio the OHDSI Methods Library has already been installed, and can be used to connect to the databases. The automation to deploy OHDSIonAWS is open-source, and can be customized to include your organization’s management tools and best practices. The architecture for OHDSIonAWS is depicted in Figure 8.11.
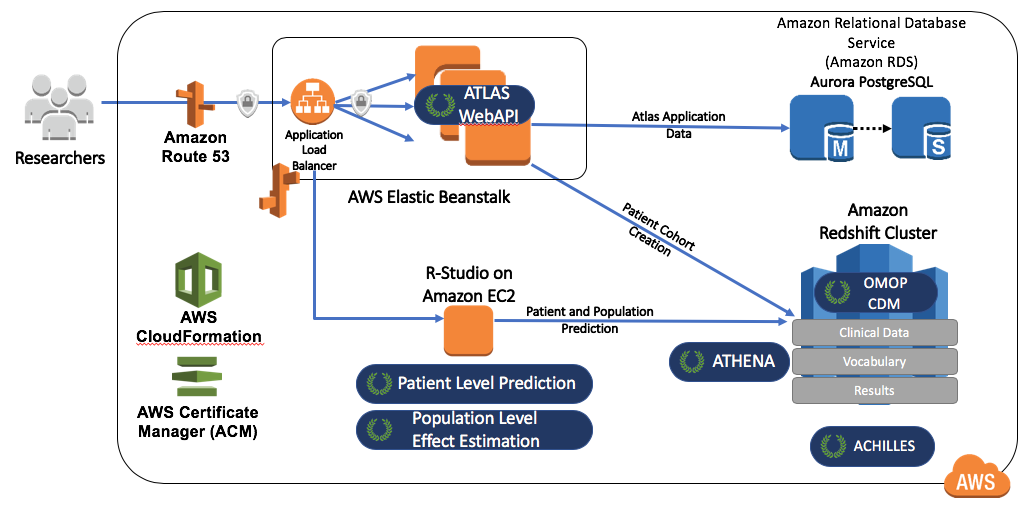
Figure 8.11: The Amazon Web Services architecture for OHDSIonAWS.
8.6 Summary
- We can perform analyses against data in the CDM by
- writing custom code
- writing code that uses the R packages in the OHDSI Methods Library
- using the interactive analysis platform ATLAS
- OHDSI tools use different analysis strategies
- Single studies
- Real-time queries
- Large-scale analytics
- The majority of OHDSI analytics tool are embedded in
- The interactive analysis platform ATLAS
- The OHDSI Methods Library R packages
- Several strategies exist facilitating the deployment of the OHDSI tools.
References
Boland, M. R., P. Parhi, L. Li, R. Miotto, R. Carroll, U. Iqbal, P. A. Nguyen, et al. 2017. “Uncovering exposures responsible for birth season - disease effects: a global study.” J Am Med Inform Assoc, September.
Duke, J. D., P. B. Ryan, M. A. Suchard, G. Hripcsak, P. Jin, C. Reich, M. S. Schwalm, et al. 2017. “Risk of angioedema associated with levetiracetam compared with phenytoin: Findings of the observational health data sciences and informatics research network.” Epilepsia 58 (8): e101–e106.
Johnston, S. S., J. M. Morton, I. Kalsekar, E. M. Ammann, C. W. Hsiao, and J. Reps. 2019. “Using Machine Learning Applied to Real-World Healthcare Data for Predictive Analytics: An Applied Example in Bariatric Surgery.” Value Health 22 (5): 580–86.
Ramcharran, D., H. Qiu, M. J. Schuemie, and P. B. Ryan. 2017. “Atypical Antipsychotics and the Risk of Falls and Fractures Among Older Adults: An Emulation Analysis and an Evaluation of Additional Confounding Control Strategies.” J Clin Psychopharmacol 37 (2): 162–68.
Reps, J. M., P. R. Rijnbeek, and P. B. Ryan. 2019. “Identifying the DEAD: Development and Validation of a Patient-Level Model to Predict Death Status in Population-Level Claims Data.” Drug Saf, May.
Reps, J. M., M. J. Schuemie, M. A. Suchard, P. B. Ryan, and P. R. Rijnbeek. 2018. “Design and implementation of a standardized framework to generate and evaluate patient-level prediction models using observational healthcare data.” Journal of the American Medical Informatics Association 25 (8): 969–75. https://doi.org/10.1093/jamia/ocy032.
Ryan, P. B., J. B. Buse, M. J. Schuemie, F. DeFalco, Z. Yuan, P. E. Stang, J. A. Berlin, and N. Rosenthal. 2018. “Comparative effectiveness of canagliflozin, SGLT2 inhibitors and non-SGLT2 inhibitors on the risk of hospitalization for heart failure and amputation in patients with type 2 diabetes mellitus: A real-world meta-analysis of 4 observational databases (OBSERVE-4D).” Diabetes Obes Metab 20 (11): 2585–97.
Ryan, P. B., M. J. Schuemie, D. Ramcharran, and P. E. Stang. 2017. “Atypical Antipsychotics and the Risks of Acute Kidney Injury and Related Outcomes Among Older Adults: A Replication Analysis and an Evaluation of Adapted Confounding Control Strategies.” Drugs Aging 34 (3): 211–19.
Schuemie, M. J., G. Hripcsak, P. B. Ryan, D. Madigan, and M. A. Suchard. 2016. “Robust empirical calibration of p-values using observational data.” Stat Med 35 (22): 3883–8.
Schuemie, M. 2018. “Empirical confidence interval calibration for population-level effect estimation studies in observational healthcare data.” Proc. Natl. Acad. Sci. U.S.A. 115 (11): 2571–7.
Schuemie, M. J., P. B. Ryan, W. DuMouchel, M. A. Suchard, and D. Madigan. 2014. “Interpreting observational studies: why empirical calibration is needed to correct p-values.” Stat Med 33 (2): 209–18.
Schuemie, M. J., P. B. Ryan, G. Hripcsak, D. Madigan, and M. A. Suchard. 2018. “Improving reproducibility by using high-throughput observational studies with empirical calibration.” Philos Trans A Math Phys Eng Sci 376 (2128).
Tian, Y., M. J. Schuemie, and M. A. Suchard. 2018. “Evaluating large-scale propensity score performance through real-world and synthetic data experiments.” Int J Epidemiol 47 (6): 2005–14.
Vashisht, R., K. Jung, A. Schuler, J. M. Banda, R. W. Park, S. Jin, L. Li, et al. 2018. “Association of Hemoglobin A1c Levels With Use of Sulfonylureas, Dipeptidyl Peptidase 4 Inhibitors, and Thiazolidinediones in Patients With Type 2 Diabetes Treated With Metformin: Analysis From the Observational Health Data Sciences and Informatics Initiative.” JAMA Netw Open 1 (4): e181755.
Wang, Y., M. Desai, P. B. Ryan, F. J. DeFalco, M. J. Schuemie, P. E. Stang, J. A. Berlin, and Z. Yuan. 2017. “Incidence of diabetic ketoacidosis among patients with type 2 diabetes mellitus treated with SGLT2 inhibitors and other antihyperglycemic agents.” Diabetes Res. Clin. Pract. 128 (June): 83–90.
Weinstein, R. B., P. Ryan, J. A. Berlin, A. Matcho, M. Schuemie, J. Swerdel, K. Patel, and D. Fife. 2017. “Channeling in the Use of Nonprescription Paracetamol and Ibuprofen in an Electronic Medical Records Database: Evidence and Implications.” Drug Saf 40 (12): 1279–92.
Yuan, Z., F. J. DeFalco, P. B. Ryan, M. J. Schuemie, P. E. Stang, J. A. Berlin, M. Desai, and N. Rosenthal. 2018. “Risk of lower extremity amputations in people with type 2 diabetes mellitus treated with sodium-glucose co-transporter-2 inhibitors in the USA: A retrospective cohort study.” Diabetes Obes Metab 20 (3): 582–89.